
Solana (SOL) price
SOL/USDT · BRVX price feed
103.96 USDT
+1.38% last 30 days
Solana's SOL is priced at 103.96 USDT on BRVX, −2.99% over the past day. You trade it as SOL/USDT, a synthetic perpetual with one of the broadest leverage ranges on BRVX, 5x to 150x, and a moderate 20x default.
Solana perpetual terms on BRVX
- Leverage
- 150x default 20x
- SOL fee per side
- 0.08% $0.80 per $1,000 of SOL
- SOL, 30 days
- 95.93 – 124.96
- SOL funding, long / short
- 0.016% / 0.0103% charged every hour
- SOL daily swing
- 4.6% average of 30
- SOL quotes
- 24/7 no market close
SOL/USDT: 0.667% against 150x equals the margin; 5% at 20x.
Solana daily range averaged 4.6% (30 sessions); 10 topped 5%; peak range 13.2%, Sep 19.
A $1,000 Solana position is 9.62 SOL at 103.96 USDT: opening it costs $0.80, closing $0.80, and holding it adds about $3.84 a day long or $2.47 short.
Solana at 150x: 0.667% against you can lose the whole margin. Past swings are no forecast.
Sources: BRVX tariffs API; SOL/USDT daily candles.
About Solana
A fast, low-fee chain
Solana's mainnet beta launched in March 2020 with a design aimed at throughput: blocks every few hundred milliseconds and fees usually a fraction of a cent. SOL pays those fees and is locked by validators who produce blocks. Payments, decentralised exchanges and, since 2024, memecoin launchpads such as pump.fun have driven much of its traffic.
Crash and comeback
SOL fell from about $260 in November 2021 to under $10 by the end of 2022 after FTX, one of its largest backers, collapsed. Several network halts in 2021–2022 added to doubts. Activity then returned, and in 2024 SOL traded above $200 again. That path explains why the coin is known for extreme swings in both directions.
What moves SOL
On-chain volume, especially memecoin trading, feeds straight into demand for SOL. Token unlocks, progress on the Firedancer validator client, network outages and flows into Solana ETF products are watched closely. SOL usually moves further than bitcoin on the same day, up and down.
SOL's validator economy
New SOL is issued as inflation to validators and those who delegate to them, starting at 8% a year and stepping down by 15% annually toward a long-term 1.5%. Half of each base transaction fee is burned. Priority fees and tips paid during busy memecoin launches have at times made validator income swing sharply week to week, a useful gauge of how much real demand the chain is seeing.
SOL on BRVX
SOL/USDT tracks the price with margin in USDC, BTC, ETH, USDT, SOL or BNB. The cap is 150x, but the app starts at 20x, lower than most markets; at the high end a routine 2% swing against you can lose the full margin. Funding differs by side: 0.016% long versus 0.0103% short per hour.
Solana price history
Solana +7.57% in 30 sessions: 16 up, 13 down; top move +10.9% on Sep 19; 7d 101.92–116.81; 30d 95.93–124.96.
| Date | Open | High | Low | Close | Change |
|---|---|---|---|---|---|
| Oct 14, 2026 | 105.76 | 109.07 | 101.92 | 106.83 | +1.01% |
| Oct 13, 2026 | 111.35 | 113.40 | 105.41 | 105.76 | −5.02% |
| Oct 12, 2026 | 110.09 | 112.75 | 108.97 | 111.35 | +1.14% |
| Oct 11, 2026 | 109.14 | 110.79 | 108.96 | 110.09 | +0.87% |
| Oct 10, 2026 | 110.34 | 112.06 | 108.46 | 109.14 | −0.44% |
| Oct 9, 2026 | 116.30 | 116.81 | 105.82 | 109.62 | −5.74% |
| Oct 8, 2026 | 118.19 | 118.23 | 115.27 | 116.30 | −3.65% |
Prices from the BRVX feed, SOL/USDT. Last candle Oct 14, 2026 UTC.
Solana's BRVX record: all-time high and full price history
Solana all-time high on BRVX: 272.83 USDT (Jan 21, 2025). Low: 60.37 USDT (Jun 7, 2026). Now 106.83, −60.85% off the top, 76.95% over the bottom. SOL/USDT history here starts Jan 2, 2025, 651 daily candles; older SOL trading is not counted.
- SOL peak
- 272.83 Jan 21, 2025
- SOL bottom
- 60.37 Jun 7, 2026
- From the peak
- −60.85% peak 272.83
- On BRVX since
- Jan 2, 2025 651 candles
- Best SOL day
- +18.81% Mar 4, 2025
- Worst SOL day
- −19.92% Mar 5, 2025
Solana returns by period
| Period | SOL change |
|---|---|
| 7 days | −11.50% |
| 30 days | +7.57% |
| 90 days | +38.22% |
| Year to date | −13.92% |
| Full SOL history | −43.69% |
Solana by month
| Month | SOL open | High | Low | Close | SOL change |
|---|---|---|---|---|---|
| Oct 2026 · to date | 119.15 | 123.76 | 101.92 | 106.83 | −10.34% |
| Sep 2026 | 101.75 | 124.96 | 95.93 | 119.15 | +17.10% |
| Aug 2026 | 73.52 | 110.60 | 70.58 | 101.75 | +38.40% |
| Jul 2026 | 73.75 | 83.98 | 72.33 | 74.52 | +1.04% |
| Jun 2026 | 82.82 | 83.36 | 60.37 | 75.17 | −9.24% |
| May 2026 | 83.09 | 97.68 | 80.13 | 82.48 | −0.73% |
| Apr 2026 | 82.48 | 89.44 | 78.41 | 84.71 | +2.70% |
| Mar 2026 | 81.81 | 96.87 | 77.35 | 84.03 | +2.71% |
| Feb 2026 | 117.56 | 118.54 | 67.92 | 87.73 | −25.37% |
| Jan 2026 | 124.77 | 146.50 | 112.67 | 115.58 | −7.37% |
| Dec 2025 | 135.99 | 146.78 | 117.69 | 124.10 | −8.74% |
| Nov 2025 | 184.24 | 188.94 | 125.29 | 137.35 | −25.45% |
Solana by day of the week
Solana on BRVX, Sat–Sun: 3.12% average move vs 2.87% Mon–Fri (1.09×), about even.
| Day | Days | SOL avg | Avg size | Up |
|---|---|---|---|---|
| Monday | 93 | +0.35% | 2.02% | 57% |
| Tuesday | 93 | +0.16% | 3.53% | 58% |
| Wednesday | 93 | −0.84% | 2.82% | 43% |
| Thursday | 92 | +0.44% | 3.00% | 45% |
| Friday | 93 | −0.07% | 2.98% | 53% |
| Saturday | 93 | −0.02% | 3.20% | 46% |
| Sunday | 93 | −0.06% | 3.04% | 51% |
SOL at 150x: a 0.667% move the wrong way can lose the whole margin.
SOL/USDT daily candles from the BRVX feed, UTC, to Oct 14, 2026. Past moves do not predict future prices.
Solana next to similar markets
Solana's 150x cap sits between Dogecoin at 80x and Bitcoin at 150x. Fees run from 0.05% per side at Sui to 0.1% at Bitcoin. In the last 24 hours Ethereum led the group, −3.50%. Of the 5 markets set against Solana here, 0 allow more leverage than its 150x, 4 allow less, and 3 charge a lower fee than its 0.08% per side.
| Market | 24h | Gap vs SOL | Leverage cap |
|---|---|---|---|
| Solana | −2.99% | — | 150x cap |
 Bitcoin Bitcoin | −1.80% | +1.19 pp | same as SOL |
 Ethereum Ethereum | −3.50% | −0.51 pp | −50x vs SOL |
 Sui Sui | −3.22% | −0.23 pp | −50x vs SOL |
 Hyperliquid Hyperliquid | −0.70% | +2.29 pp | −50x vs SOL |
 Dogecoin Dogecoin | −3.30% | −0.31 pp | −70x vs SOL |
Where SOL's cap is higher, a smaller move can lose the whole margin.
Before you open a Solana position
Use a Solana-friendly wallet
Sign in by email or connect a wallet through WalletConnect, including Trust Wallet and other multichain apps.
SOL can be the margin
Deposit USDC, BTC, ETH, USDT, SOL or BNB. Posting SOL as margin on a SOL long adds a second layer of exposure to the same coin.
Trade the memecoin cycle
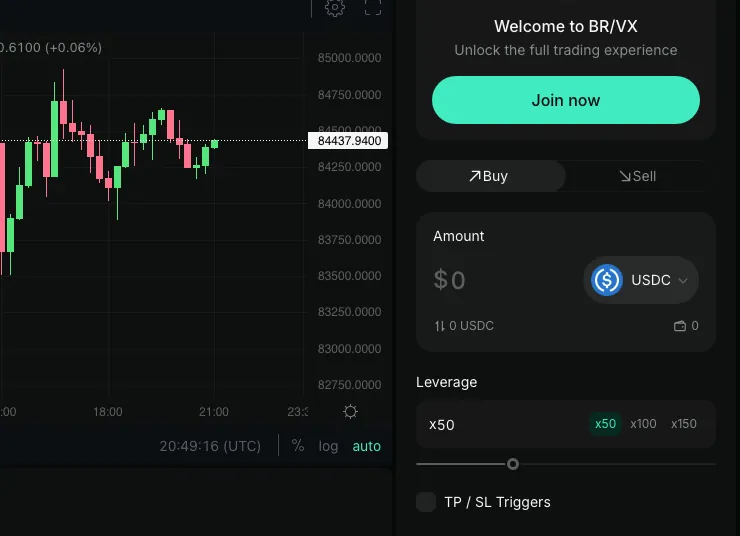
Open SOL/USDT; buy if you expect on-chain activity to pick up, sell if hype is fading. Start from the 20x default and add TP / SL.
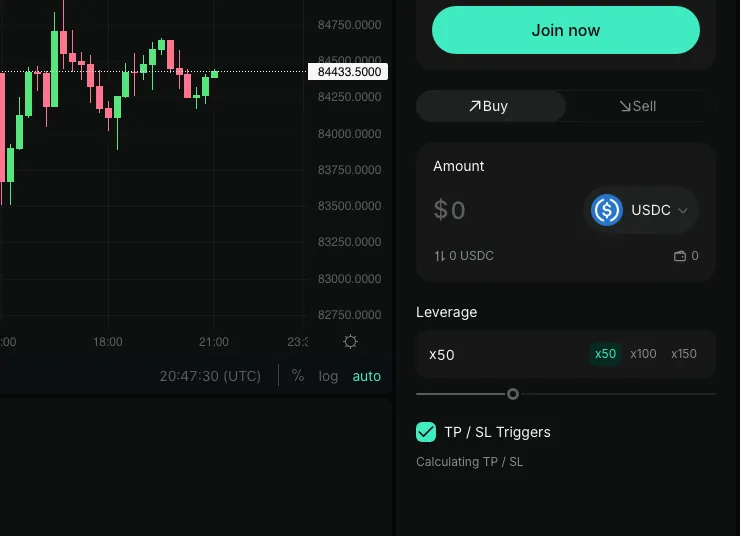


SOL at 150x: a 0.667% move the wrong way can lose the whole margin.
Long or short Solana
SOL/USDT scenario with fees and funding omitted. Exposure = margin × leverage.
The opposite 5% is a $60 loss; at 15x, about 6.7% against you equals the whole $80.
 SOL Solana
 - Price move
- +3% $107.07
- Position P&L
- +$36.00
- On margin
- +45%
Hypothetical SOL figures. At 15x, 6.67% against you equals the margin; you can lose all of it.
Calculate your liquidation priceSolana price FAQ
Step-by-step long and short: how to trade Solana.
What is the Solana price today?
SOL is 103.96 USDT on BRVX (SOL/USDT), −2.99% in 24 hours; live in the app.
What happened to SOL after FTX?
FTX and its trading arm were large SOL holders. After their collapse in November 2022, SOL fell below $10 before recovering over 2023–2024.
Why does memecoin activity affect SOL?
Most new memecoins in 2024 launched on Solana. Trading them requires SOL for fees and pairs, so activity spikes lift demand.
Why is the default leverage lower on SOL?
BRVX presets 20x on SOL even though the cap is 150x. SOL can move 5–10% in a day, and a lower default reduces the risk of losing the full margin on a routine swing.
What are the fees on SOL/USDT?
0.08% to open and 0.08% to close, plus funding every hour: 0.016% for longs, 0.0103% for shorts.
Who founded Solana?
Anatoly Yakovenko, a former Qualcomm engineer, described proof of history in 2017 and co-founded Solana Labs with Raj Gokal.
How much does Solana move in a day?
4.6% on an average SOL day (30 sessions); peak range 13.2% on Sep 19; 16 up, 13 down. At 20x, 5% against you equals the margin, which you can lose.
How much SOL does $100 of margin control?
At 103.96 USDT: 19.2 SOL at 20x, 144 SOL at 150x. Losses grow by the same multiple.
Trade Solana with up to 150x
Open appSOL can move 10% in a day. Leverage adds to that risk; size accordingly. Not available to US persons.