Meta (META) stock price
META/USDT · BRVX price feed
738.55 USDT
+11.05% last 30 days
Meta Platforms (META) is at 738.55 USDT on BRVX, having moved 0.00% in 24 hours. It is listed on BRVX as META/USDT, a perpetual contract on the Meta share price that trades all week, day and night. Go long or short from 5x up to 100x leverage; you trade price changes and never receive Meta shares.
Meta perpetual terms on BRVX
- Leverage
- 100x default 50x
- META fee per side
- 0.05% $0.50 per $1,000 of META
- META, 30 days
- 637.33 – 781.18
- META funding
- 0.0046% charged every hour
- META daily swing
- 3.1% average of 30
- META quotes
- 24/7 outside Nasdaq hours too
META/USDT: 1% against 100x equals the margin; 2% at 50x.
Meta daily range averaged 3.1% (30 sessions); 19 topped 2%; peak range 12.11%, Sep 22.
A $1,000 Meta position is 1.35 META at 738.55 USDT: opening it costs $0.50, closing $0.50, and each day held adds about $1.10 of META funding.
Meta at 100x: 1% against you can lose the whole margin. Past swings are no forecast.
Sources: BRVX tariffs API; META/USDT daily candles.
About Meta
An ad business built on four apps
Meta Platforms owns Facebook, Instagram, WhatsApp and Messenger, plus the newer Threads. Together they reach billions of people each day, and almost all of Meta's revenue comes from selling ads on them. A separate unit, Reality Labs, builds Quest VR headsets and smart glasses; it has lost tens of billions of dollars so far. Mark Zuckerberg founded the company as Facebook in 2004 and renamed it Meta in 2021.
The 2022 crash and the rebound
In 2022 the stock fell about three quarters from its peak: Apple's privacy change made ad targeting harder, TikTok competed for attention and spending on the metaverse ballooned. In 2023 Meta cut costs and jobs, and ad revenue recovered, so the shares rebounded sharply. That episode shows how fast sentiment on META can turn.
What moves META
Ad pricing and the number of ad impressions, the outlook for the next quarter and, increasingly, the capital budget for AI data centres. When Meta raises spending plans more than expected, the stock has sometimes fallen even after strong revenue. Regulation matters as well: EU rules on data and competition, US antitrust cases and child-safety laws.
Report timing
Meta reports after the Nasdaq close, typically in late January or early February, late April, late July and late October. Because the stock often moves 10% or more the next day, the report is the main scheduled event for META traders.
AI as product and cost
Meta uses AI to rank feeds and target ads, which has helped ad prices, and it releases its Llama models openly for developers. It also offers Meta AI, an assistant inside its apps. Training these systems needs huge data centres, so Meta's capital spending has climbed steeply. The stock reaction to each report now depends on whether revenue growth keeps up with that bill.
META/USDT on BRVX
META/USDT is a synthetic perpetual contract that tracks the Meta share price in USDT, with margin in USDC, BTC, ETH, USDT, SOL or BNB and no expiry. The contract keeps trading after 16:00 New York time, so the results-night move is priced immediately. Meta started paying a dividend in 2024; the perp pays none, since you hold a price position, not stock.
Meta price history
Meta +18.58% in 30 sessions: 17 up, 12 down; top move +10.1% on Sep 22; 7d 710.66–771.98; 30d 637.33–781.18.
| Date | Open | High | Low | Close | Change |
|---|---|---|---|---|---|
| Oct 14, 2026 | 742.29 | 771.98 | 732.04 | 763.28 | +2.83% |
| Oct 13, 2026 | 722.97 | 752.68 | 719.94 | 742.28 | +2.67% |
| Oct 12, 2026 | 719.58 | 722.98 | 719.22 | 722.97 | +0.47% |
| Oct 11, 2026 | 718.34 | 720.43 | 717.92 | 719.58 | +0.17% |
| Oct 10, 2026 | 723.00 | 728.50 | 716.87 | 718.33 | −0.22% |
| Oct 9, 2026 | 723.45 | 734.46 | 710.66 | 719.92 | −0.49% |
| Oct 8, 2026 | 740.95 | 741.76 | 720.54 | 723.45 | −2.25% |
Prices from the BRVX feed, META/USDT. Last candle Oct 14, 2026 UTC.
Meta price history & all-time high on BRVX
Meta all-time high on BRVX: 781.18 USDT (Sep 26, 2026). Low: 519.03 USDT (Jul 30, 2026). Now 763.28, −2.29% off the top, 47.06% over the bottom. META/USDT history here starts Jun 26, 2026, 110 daily candles; older META trading is not counted.
- META peak
- 781.18 Sep 26, 2026
- META bottom
- 519.03 Jul 30, 2026
- From the peak
- −2.29% peak 781.18
- On BRVX since
- Jun 26, 2026 110 candles
- Best META day
- +10.10% Sep 22, 2026
- Worst META day
- −9.16% Jul 30, 2026
Meta returns by period
| Period | META change |
|---|---|
| 7 days | +3.13% |
| 30 days | +18.58% |
| 90 days | +12.22% |
| Year to date | META history starts later |
| Full META history | +38.38% |
Meta by month
| Month | META open | High | Low | Close | META change |
|---|---|---|---|---|---|
| Oct 2026 · to date | 743.70 | 771.98 | 710.66 | 763.28 | +2.63% |
| Sep 2026 | 576.77 | 781.18 | 569.48 | 743.70 | +28.94% |
| Aug 2026 | 547.05 | 612.70 | 538.10 | 576.77 | +5.43% |
| Jul 2026 | 563.44 | 690.33 | 519.03 | 543.29 | −3.58% |
| Jun 2026 · partial | 551.58 | 570.55 | 539.01 | 563.47 | +2.16% |
How Meta trades across the week
Meta on BRVX, Sat–Sun: 0.94% average move vs 1.90% Mon–Fri (0.49×); weekends ran calmer.
| Day | Days | META avg | Avg size | Up |
|---|---|---|---|---|
| Monday | 15 | +0.11% | 0.37% | 67% |
| Tuesday | 16 | +0.99% | 2.61% | 63% |
| Wednesday | 16 | +0.59% | 1.22% | 75% |
| Thursday | 15 | +0.15% | 3.30% | 53% |
| Friday | 15 | +0.30% | 2.02% | 40% |
| Saturday | 16 | 0.00% | 1.56% | 63% |
| Sunday | 16 | +0.23% | 0.32% | 75% |
META at 100x: a 1% move the wrong way can lose the whole margin.
META/USDT daily candles from the BRVX feed, UTC, to Oct 14, 2026. Past moves do not predict future prices.
Meta next to similar markets
Meta's 100x cap sits between Alphabet at 60x and Amazon at 100x. Meta's 100x cap is beaten by 0 of the 5 markets shown and topped by none of the rest; on fees, 0 of them undercut its 0.05% per side.
| Market | 24h | Gap vs META | Leverage cap |
|---|---|---|---|
| Meta | — | — | 100x cap |
| Alphabet | — | — | −40x vs META |
 Amazon Amazon | — | — | same as META |
 Microsoft Microsoft | — | — | same as META |
| Apple | — | — | −20x vs META |
 XYZ100 XYZ100 | — | — | −30x vs META |
Where META's cap is higher, a smaller move can lose the whole margin.
Before you open a Meta position
Start
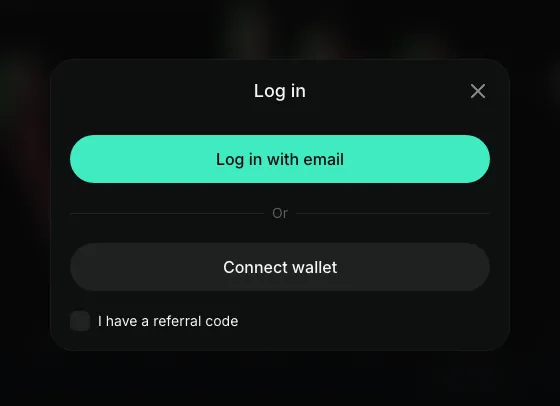
Use email or a crypto wallet to log in.
Fund
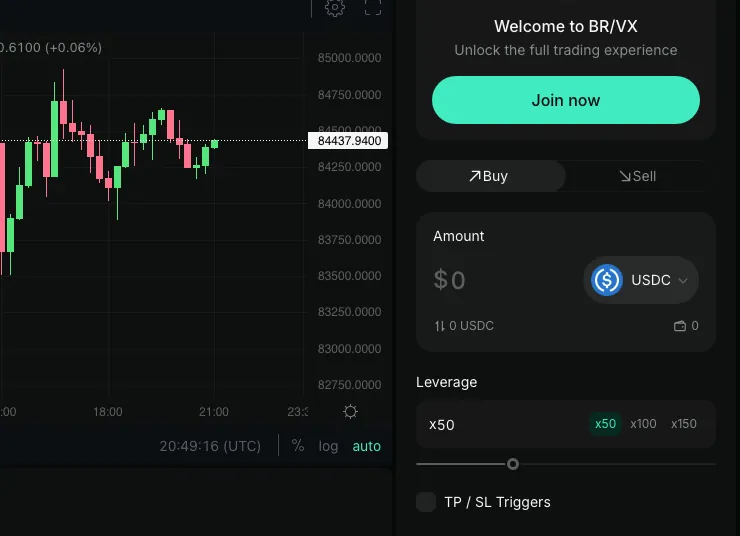
Add crypto to the balance. That becomes the collateral for your Meta trade.
Trade META/USDT
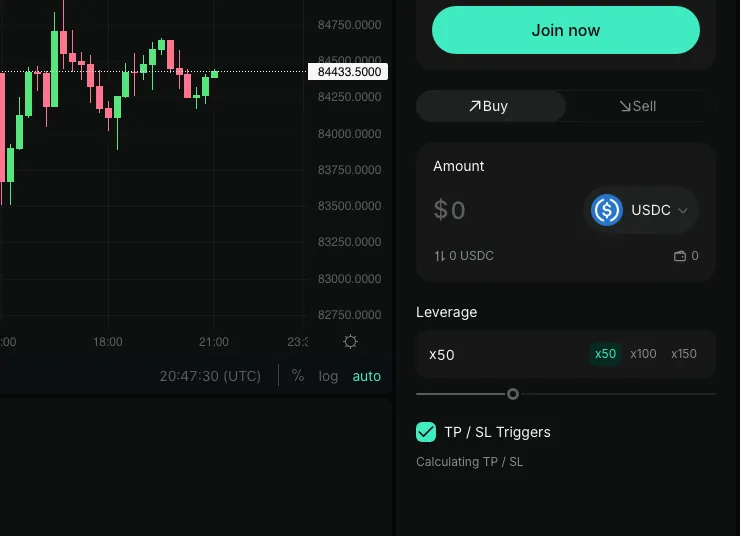
Long if you expect ad revenue to beat, short if you expect the AI budget to spook investors. Leverage is 5x to 100x; on a stock that can gap 10% after a report, high settings bring big losses fast.


META at 100x: a 1% move the wrong way can lose the whole margin.
Meta on results night, two ways
An example META/USDT trade, with fees and funding set aside.
Meta has moved more than 10% after several reports. That is why this example uses only 2x: at higher multipliers the same gap can lose most or all of the margin.
- Price move
- +3% $760.71
- Position P&L
- +$24.00
- On margin
- +6%
Hypothetical META figures. At 2x, 50% against you equals the margin; you can lose all of it.
Calculate your liquidation priceMeta price FAQ
Step-by-step long and short: how to trade Meta. Next report date and call time: Meta earnings date.
What is Meta stock worth today?
On BRVX, META/USDT is quoted at 738.55 USDT, 0.00% over the last day. The price updates all night and all weekend.
Is META/USDT tradable on weekends?
Yes. The Meta contract on BRVX quotes 24/7, including weekends and US holidays.
What leverage is offered on Meta?
5x to 100x, preset at 50x. Given Meta's history of big results-day gaps, higher multipliers can turn one report into losses bigger than the margin you planned to risk.
What does it cost to hold a Meta position?
0.05% of the position to open and 0.05% to close, plus funding of 0.0046% each hour for as long as it is open.
Why did Facebook change its name to Meta?
In October 2021 the company renamed itself to signal a shift towards virtual and augmented reality, the so-called metaverse. The ticker changed from FB to META in 2022.
How much does Meta move in a day?
3.1% on an average META day (30 sessions); peak range 12.11% on Sep 22; 17 up, 12 down. At 50x, 2% against you equals the margin, which you can lose.
How far does $100 go on META?
Far enough for 6.77 META at 50x default leverage, 13.5 at the 100x cap, all off a 738.55 USDT price. Whatever multiplies the position multiplies the loss.
What is Meta's record high on BRVX?
781.18 USDT, set Sep 26, 2026 — the highest META/USDT print since BRVX started recording it on Jun 26, 2026. It now sits −2.29% under that, at 763.28. The floor so far: 519.03 USDT (Jul 30, 2026).
Meta's report is priced the minute it drops
Open appMeta can gap 10% or more after results; leverage can turn that into losses beyond your plan. Not available to US persons.