
Amazon (AMZN) stock price
AMZN/USDT · BRVX price feed
253.91 USDT
+0.08% last 30 days
Amazon (AMZN) trades at 253.91 USDT on BRVX, 0.00% in the last 24 hours. The market is AMZN/USDT: a perpetual contract that tracks the Amazon share price and keeps quoting around the clock, weekends included. Take a long or short position with 5x to 100x leverage; the contract pays out on price moves only, with no shares behind it.
Amazon perpetual terms on BRVX
- Leverage
- 100x default 50x
- AMZN fee per side
- 0.05% $0.50 per $1,000 of AMZN
- AMZN, 30 days
- 244.53 – 264.96
- AMZN funding
- 0.0046% charged every hour
- AMZN daily swing
- 1.77% average of 30
- AMZN quotes
- 24/7 outside Nasdaq hours too
AMZN/USDT: 1% against 100x equals the margin; 2% at 50x.
Amazon daily range averaged 1.77% (30 sessions); 16 topped 2%; peak range 3.61%, Sep 24.
A $1,000 Amazon position is 3.94 AMZN at 253.91 USDT: opening it costs $0.50, closing $0.50, and each day held adds about $1.10 of AMZN funding.
Amazon at 100x: 1% against you can lose the whole margin. Past swings are no forecast.
Sources: BRVX tariffs API; AMZN/USDT daily candles.
About Amazon
Store, cloud and ad network
Amazon started in 1994 as an online bookshop run by Jeff Bezos from a garage in Bellevue, Washington. Today it has three engines: the retail marketplace with Prime membership, Amazon Web Services (AWS), which rents computing power to companies, and a fast-growing advertising business that sells placements on its store. Retail brings most of the sales, but AWS and ads bring most of the profit. Andy Jassy has been CEO since 2021.
What the market prices into AMZN
The first line many analysts read is AWS growth, because it shows how much companies are spending on cloud and AI. Next come operating margin in North American retail, ad revenue and the capital budget for data centres. The forecast for the next quarter often matters more than the quarter itself; a soft outlook has sent the stock lower even after strong results.
Seasons of the year
The fourth quarter, with Black Friday and the holidays, is the biggest for sales, and the guidance given in late October sets the tone for it. Prime Day, usually in July, gives an early read on shoppers. Consumer-spending data, shipping costs and tariffs on imported goods can move the stock between reports.
A few milestones
Amazon listed in 1997. AWS launched in 2006 and began reporting its own numbers in 2015, which changed how investors valued the company. In June 2022 the stock was split 20-for-1. After the 2021 peak it lost about half its value in 2022, when online sales growth slowed and costs had been built for a boom that did not last.
Heavy spending, long horizon
Amazon invests more in capital projects than almost any other company: data centres for AWS, its own AI chips called Trainium, a logistics network of warehouses and delivery vans, and Project Kuiper, a satellite internet network. Investors accept large budgets while AWS grows, but a jump in spending without faster growth can pressure the shares.
AMZN/USDT on BRVX
The pair AMZN/USDT is a synthetic perpetual contract tracking Amazon's share price, quoted in USDT. It never expires, and you back it with USDC, BTC, ETH, USDT, SOL or BNB. Amazon reports after the Nasdaq close; on BRVX the reaction is priced the same evening and keeps trading through the weekend. You hold a price position, not Amazon shares.
Amazon price history
Amazon +1.74% in 30 sessions: 16 up, 13 down; top move +3.07% on Oct 10; 7d 252.96–264.96; 30d 244.53–264.96.
| Date | Open | High | Low | Close | Change |
|---|---|---|---|---|---|
| Oct 14, 2026 | 259.96 | 263.13 | 257.61 | 258.12 | −0.70% |
| Oct 13, 2026 | 263.35 | 264.96 | 259.61 | 259.95 | −1.29% |
| Oct 12, 2026 | 262.53 | 263.39 | 262.53 | 263.35 | +0.31% |
| Oct 11, 2026 | 262.73 | 262.77 | 262.47 | 262.53 | −0.07% |
| Oct 10, 2026 | 256.31 | 262.91 | 255.15 | 262.72 | +3.07% |
| Oct 9, 2026 | 260.29 | 260.77 | 253.99 | 254.91 | −2.07% |
| Oct 8, 2026 | 257.88 | 260.57 | 253.29 | 260.29 | +1.16% |
Prices from the BRVX feed, AMZN/USDT. Last candle Oct 14, 2026 UTC.
Amazon price history & all-time high on BRVX
Amazon all-time high on BRVX: 287.44 USDT (Aug 4, 2026). Low: 224.65 USDT (Jul 30, 2026). Now 258.12, −10.20% off the top, 14.90% over the bottom. AMZN/USDT history here starts Jun 26, 2026, 110 daily candles; older AMZN trading is not counted.
- AMZN peak
- 287.44 Aug 4, 2026
- AMZN bottom
- 224.65 Jul 30, 2026
- From the peak
- −10.20% peak 287.44
- On BRVX since
- Jun 26, 2026 110 candles
- Best AMZN day
- +12.12% Jul 31, 2026
- Worst AMZN day
- −3.16% Jul 24, 2026
Amazon returns by period
| Period | AMZN change |
|---|---|
| 7 days | +0.32% |
| 30 days | +1.74% |
| 90 days | +1.06% |
| Year to date | AMZN history starts later |
| Full AMZN history | +12.80% |
Amazon by month
| Month | AMZN open | High | Low | Close | AMZN change |
|---|---|---|---|---|---|
| Oct 2026 · to date | 247.46 | 264.96 | 245.86 | 258.12 | +4.31% |
| Sep 2026 | 265.61 | 266.92 | 244.53 | 247.46 | −6.83% |
| Aug 2026 | 262.28 | 287.44 | 255.02 | 265.61 | +1.27% |
| Jul 2026 | 240.35 | 260.19 | 224.65 | 258.24 | +7.44% |
| Jun 2026 · partial | 228.83 | 246.50 | 225.20 | 240.39 | +5.05% |
Amazon by day of the week
Amazon on BRVX, Sat–Sun: 0.92% average move vs 1.19% Mon–Fri (0.77×); weekends ran calmer.
| Day | Days | AMZN avg | Avg size | Up |
|---|---|---|---|---|
| Monday | 15 | +0.15% | 0.44% | 67% |
| Tuesday | 16 | +0.13% | 1.08% | 44% |
| Wednesday | 16 | −0.51% | 0.98% | 31% |
| Thursday | 15 | −0.12% | 1.50% | 47% |
| Friday | 15 | +0.20% | 1.98% | 40% |
| Saturday | 16 | +0.95% | 1.57% | 63% |
| Sunday | 16 | +0.13% | 0.26% | 69% |
AMZN at 100x: a 1% move the wrong way can lose the whole margin.
AMZN/USDT daily candles from the BRVX feed, UTC, to Oct 14, 2026. Past moves do not predict future prices.
Amazon next to similar markets
Amazon's 100x cap sits between Alphabet at 60x and Microsoft at 100x. Of the 5 markets set against Amazon here, 0 allow more leverage than its 100x, 3 allow less, and 0 charge a lower fee than its 0.05% per side.
| Market | 24h | Gap vs AMZN | Leverage cap |
|---|---|---|---|
| Amazon | — | — | 100x cap |
 Microsoft Microsoft | — | — | same as AMZN |
| Meta | — | — | same as AMZN |
| Alphabet | — | — | −40x vs AMZN |
| Apple | — | — | −20x vs AMZN |
 XYZ100 XYZ100 | — | — | −30x vs AMZN |
Where AMZN's cap is higher, a smaller move can lose the whole margin.
Before you open a Amazon position
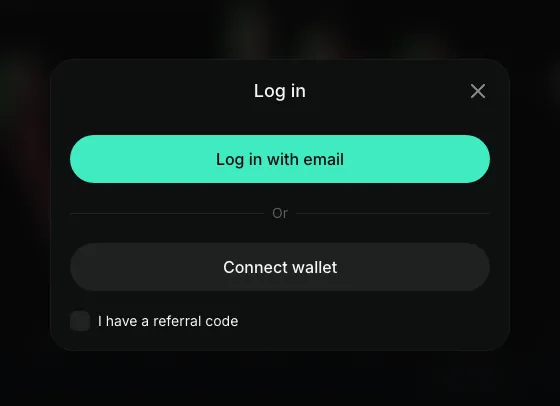
Open an account
An email address or a wallet connection is enough to start.
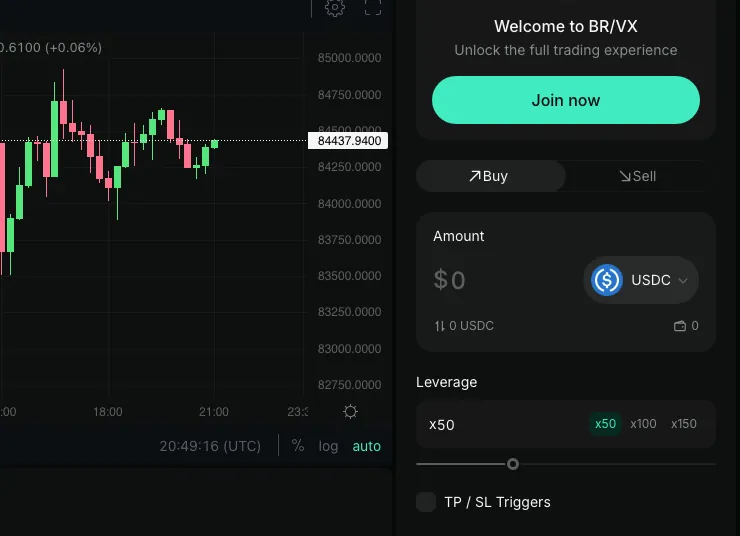
Add collateral
Top up with USDT, USDC or a major coin. Your Amazon exposure is built on this margin.
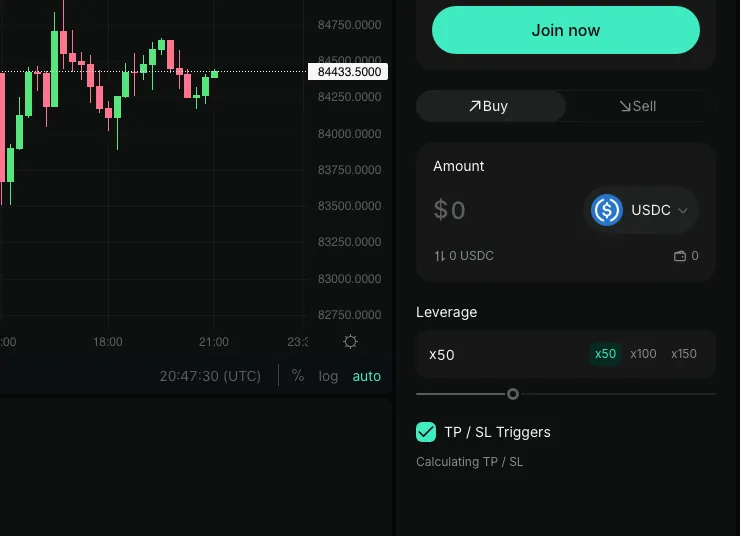
Choose direction on AMZN/USDT
Long if you expect AWS or holiday sales to impress, short if you expect a soft guide. Leverage runs from 5x to 100x; losses grow with the multiplier, so a stop-loss helps on results night.


AMZN at 100x: a 1% move the wrong way can lose the whole margin.
Amazon up or down: a sample trade
Illustrative AMZN/USDT maths around a results night. Costs are excluded.
Amazon has gapped 5–10% after several reports. A modest multiplier like 3x keeps such a gap well inside the margin, though losses on it are still real.
 AMZN Amazon
 - Price move
- +3% $261.52
- Position P&L
- +$27.00
- On margin
- +9%
Hypothetical AMZN figures. At 3x, 33.33% against you equals the margin; you can lose all of it.
Calculate your liquidation priceAmazon price FAQ
Step-by-step long and short: how to trade Amazon. Next report date and call time: Amazon earnings date.
What is Amazon trading at today?
AMZN/USDT is at 253.91 USDT on BRVX, 0.00% across the last 24 hours. The number keeps updating outside US hours.
How high can leverage go on Amazon?
Up to 100x, starting from 5x, with 50x as the default. A higher setting means a smaller move against you can lose the whole margin, so size it for a results-night gap.
What are the costs on AMZN?
0.05% to enter and 0.05% to exit, calculated on the position value, plus funding of 0.0046% per hour while the position runs.
What does the 2022 split mean for the chart?
Each share became 20 in June 2022. Prices before that are adjusted on our chart, so they line up with today's quote.
How volatile is Amazon day to day?
30 sessions average 1.77% of range, split 16 up and 13 down; the biggest was 3.61% on Sep 24. Default leverage is 50x, where 2% against you is the whole margin.
What does $100 of margin buy on AMZN?
19.7 AMZN at the default 50x, or 39.4 AMZN if you push it to 100x — both priced off 253.91 USDT. A loss scales the same way as the position.
Has Amazon made a new high on BRVX?
Its best print remains 287.44 USDT from Aug 4, 2026, −10.20% above the current 258.12. The other extreme, 224.65 USDT on Jul 30, 2026, is the low for the AMZN/USDT record that started Jun 26, 2026.
Can weekend moves in Amazon wipe out margin?
They can: AMZN has swung 0.92% on an average weekend day since Jun 26, 2026, versus 1.19% on a weekday, and leverage applies the same way both days.
Trade Amazon's report the night it lands
Open appA soft guide can send AMZN sharply lower overnight; size positions so you can take the losses. Not available to US persons.