
Nasdaq-100 (US100) price
XYZ100/USDT · BRVX price feed
29,965.96 USDT
+2.79% last 30 days
The Nasdaq-100 stands at 29,965.96 USDT on BRVX, 0.00% across 24 hours. BRVX carries it as XYZ100/USDT, a synthetic perpetual tracking the Nasdaq-100 index, with quotes that keep updating after Wall Street closes and through the weekend.
Nasdaq-100 perpetual terms on BRVX
- Leverage
- 70x default 30x
- XYZ100 fee per side
- 0.05% $0.50 per $1,000 of XYZ100
- XYZ100, 30 days
- 28,781.05 – 31,367.27
- XYZ100 funding
- 0.0068% charged every 3 hours
- XYZ100 daily swing
- 1.13% average of 30
- XYZ100 quotes
- 24/7 outside Nasdaq hours too
XYZ100/USDT: 1.429% against 70x equals the margin; 3.333% at 30x.
Nasdaq-100 daily range averaged 1.13% (30 sessions), none above 3.333%; peak range 2.77%, Sep 22. Quiet weeks can still end in a gap.
A $1,000 Nasdaq-100 position is 0.0334 XYZ100 at 29,965.96 USDT: opening it costs $0.50, closing $0.50, and each day held adds about $0.55 of XYZ100 funding.
Nasdaq-100 at 70x: 1.429% against you can lose the whole margin. Past swings are no forecast.
Sources: BRVX tariffs API; XYZ100/USDT daily candles.
About the Nasdaq-100
What the index contains
The Nasdaq-100 holds the 100 largest non-financial companies listed on the Nasdaq exchange, so banks are excluded while software, chips, internet platforms, biotech and retail are in. It was launched in 1985 and is weighted by market value with caps, which means a handful of mega-caps such as Apple, Microsoft, Nvidia, Amazon and Alphabet account for a large share of every move. It is rebalanced quarterly and reconstituted each December.
What drives it
Tech valuations lean on earnings expected years ahead, so the index is sensitive to long-term Treasury yields: rising yields discount that distant income more heavily. Earnings seasons in January, April, July and October bring big single-stock gaps that pass straight into the index, and Nvidia's quarterly report has become a market-wide event. Fed meetings and US CPI prints round out the calendar.
Crashes and recoveries
The dot-com bust took the index down roughly 80% between March 2000 and October 2002, and it took about fifteen years to regain that peak. In 2022 it fell about a third as rates rose, then set new highs in 2024 on AI enthusiasm. Drawdowns of 10% within a few weeks happen most years.
Concentration risk
A small group of mega-cap companies has made up close to half of the index weight in recent years, which prompted Nasdaq to run a special rebalance in July 2023 to cut their share. That concentration means one disappointing report from Apple, Microsoft or Nvidia can outweigh good news from dozens of smaller members, and it makes the Nasdaq-100 behave more like a bet on large-cap US tech than on the wider economy.
XYZ100 on BRVX
BRVX lists the index as XYZ100/USDT; it tracks the Nasdaq-100 and is not affiliated with Nasdaq. Funding is charged every 3 hours rather than hourly, the app defaults to 30x, and the cap is 70x. Index gaps after big earnings can exceed 3%, and at high leverage that risk can take the full margin.
Nasdaq-100 price history
Nasdaq-100 +5.34% in 30 sessions: 18 up, 11 down; top move +2.74% on Sep 22; 7d 29,892.49–31,236.02; 30d 28,781.05–31,367.27.
| Date | Open | High | Low | Close | Change |
|---|---|---|---|---|---|
| Oct 14, 2026 | 30,621.36 | 30,653.40 | 30,416.15 | 30,566.66 | −0.18% |
| Oct 13, 2026 | 31,072.25 | 31,080.67 | 30,615.35 | 30,621.05 | −1.45% |
| Oct 12, 2026 | 30,944.31 | 31,094.54 | 30,918.83 | 31,072.25 | +0.41% |
| Oct 11, 2026 | 30,930.20 | 31,000.80 | 30,910.58 | 30,944.31 | +0.05% |
| Oct 10, 2026 | 30,995.93 | 31,053.30 | 30,796.87 | 30,929.89 | +0.55% |
| Oct 9, 2026 | 31,193.29 | 31,236.02 | 30,577.49 | 30,759.46 | −1.39% |
| Oct 8, 2026 | 31,143.04 | 31,224.33 | 30,912.49 | 31,193.45 | −0.17% |
Prices from the BRVX feed, XYZ100/USDT. Last candle Oct 14, 2026 UTC.
How Nasdaq-100 has traded: all-time high, all-time low, history
Nasdaq-100 all-time high on BRVX: 31,367.27 USDT (Oct 7, 2026). Low: 27,096.37 USDT (Jul 30, 2026). Now 30,566.66, −2.55% off the top, 12.81% over the bottom. XYZ100/USDT history here starts Jun 26, 2026, 110 daily candles; older XYZ100 trading is not counted.
- XYZ100 peak
- 31,367.27 Oct 7, 2026
- XYZ100 bottom
- 27,096.37 Jul 30, 2026
- From the peak
- −2.55% peak 31,367.27
- On BRVX since
- Jun 26, 2026 110 candles
- Best XYZ100 day
- +3.29% Jul 31, 2026
- Worst XYZ100 day
- −2.30% Jul 14, 2026
Nasdaq-100 returns by period
| Period | XYZ100 change |
|---|---|
| 7 days | −2.18% |
| 30 days | +5.34% |
| 90 days | +3.57% |
| Year to date | XYZ100 history starts later |
| Full XYZ100 history | +4.20% |
Nasdaq-100 by month
| Month | XYZ100 open | High | Low | Close | XYZ100 change |
|---|---|---|---|---|---|
| Oct 2026 · to date | 30,449.25 | 31,367.27 | 30,253.46 | 30,566.66 | +0.39% |
| Sep 2026 | 29,244.95 | 30,804.70 | 28,781.05 | 30,449.09 | +4.12% |
| Aug 2026 | 28,472.19 | 30,282.43 | 27,993.51 | 29,246.95 | +2.72% |
| Jul 2026 | 29,759.00 | 30,322.00 | 27,096.37 | 28,326.47 | −4.81% |
| Jun 2026 · partial | 29,335.00 | 29,781.00 | 28,874.00 | 29,760.00 | +1.45% |
Nasdaq-100 by day of the week
Nasdaq-100 on BRVX, Sat–Sun: 0.44% average move vs 0.92% Mon–Fri (0.48×); weekends ran calmer.
| Day | Days | XYZ100 avg | Avg size | Up |
|---|---|---|---|---|
| Monday | 15 | +0.24% | 0.56% | 67% |
| Tuesday | 16 | −0.13% | 1.06% | 44% |
| Wednesday | 16 | +0.24% | 1.03% | 50% |
| Thursday | 15 | −0.17% | 0.75% | 47% |
| Friday | 15 | −0.07% | 1.16% | 47% |
| Saturday | 16 | +0.09% | 0.71% | 63% |
| Sunday | 16 | +0.09% | 0.17% | 56% |
XYZ100 at 70x: a 1.429% move the wrong way can lose the whole margin.
XYZ100/USDT daily candles from the BRVX feed, UTC, to Oct 14, 2026. Past moves do not predict future prices.
Nasdaq-100 next to similar markets
Nasdaq-100's 70x cap sits between NVIDIA at 50x and Microsoft at 100x. In the last 24 hours NVIDIA led the group, −3.62%. Of the 5 markets set against Nasdaq-100 here, 3 allow more leverage than its 70x, 2 allow less, and 0 charge a lower fee than its 0.05% per side.
| Market | 24h | Gap vs XYZ100 | Leverage cap |
|---|---|---|---|
| Nasdaq-100 | — | — | 70x cap |
| NVIDIA | −3.62% | — | −20x vs XYZ100 |
| Apple | — | — | +10x vs XYZ100 |
 Microsoft Microsoft | — | — | +30x vs XYZ100 |
| Tesla | −2.09% | — | −20x vs XYZ100 |
| Meta | — | — | +30x vs XYZ100 |
Where XYZ100's cap is higher, a smaller move can lose the whole margin.
Before you open a Nasdaq-100 position
No brokerage account needed
Sign in with email or a wallet; you do not need a US securities account to follow the index.
Back it with crypto
Deposit USDC, BTC, ETH, USDT, SOL or BNB. The balance margins XYZ100 alongside your crypto or stock positions.
Trade tech as one basket
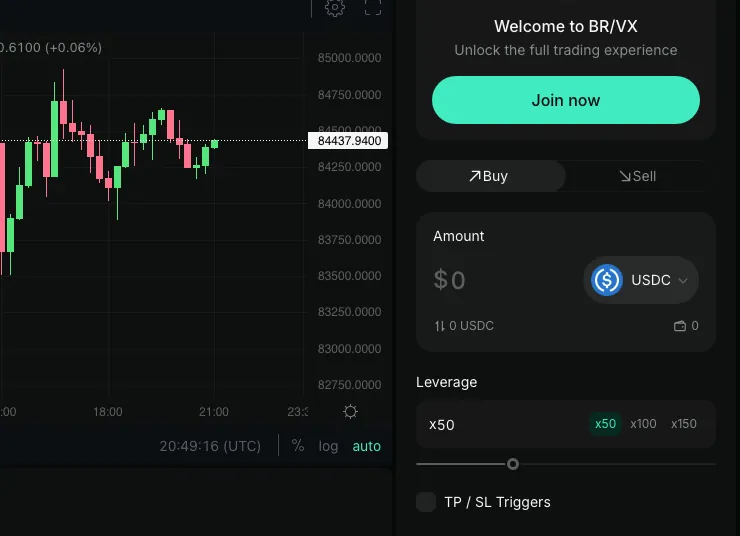
Open XYZ100/USDT and buy if you expect mega-cap earnings or falling yields to lift tech, sell if you expect a rate scare. Set take-profit and stop-loss before a big report.
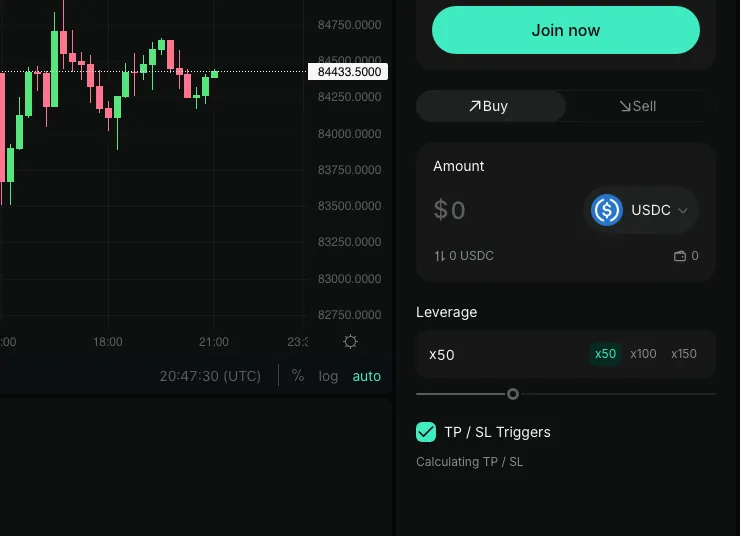


XYZ100 at 70x: a 1.429% move the wrong way can lose the whole margin.
Long or short the Nasdaq-100
XYZ100/USDT example, with fees and funding left out. Exposure = margin × leverage.
Flip the outcome and the $25 is lost. At 40x, a 2.5% move against the trade equals the whole margin.
 XYZ100 XYZ100
 - Price move
- +3% $30,864.94
- Position P&L
- +$30.00
- On margin
- +6%
Hypothetical XYZ100 figures. At 2x, 50% against you equals the margin; you can lose all of it.
Calculate your liquidation priceNasdaq-100 price FAQ
Step-by-step long and short: how to trade Nasdaq-100.
What is the Nasdaq-100 at today?
29,965.96 USDT on BRVX's XYZ100/USDT, 0.00% over the past 24 hours; the app shows it live.
What is the difference between the Nasdaq-100 and the Nasdaq Composite?
The Composite includes nearly every stock listed on Nasdaq, financials too. The Nasdaq-100 takes only the 100 largest non-financial names.
Why is funding charged less often on this market?
XYZ100 uses a 3 hours funding period, unlike the hourly schedule on most BRVX markets. Current rates are 0.0068% for longs and 0.0068% for shorts.
What does it cost to open and close?
0.05% of position size to open and 0.05% to close.
How much leverage is available on the index?
5x to 70x, default 30x. Tech can gap several percent on one earnings report, and at high settings that risk can take the full margin.
How is the Nasdaq-100 different from the S&P 500?
The S&P 500 covers 500 large US companies across all sectors, banks included. The Nasdaq-100 is narrower and heavier in technology, so it tends to rise and fall more sharply.
How much does Nasdaq-100 move in a day?
1.13% on an average XYZ100 day (30 sessions); peak range 2.77% on Sep 22; 18 up, 11 down. At 30x, 3.333% against you equals the margin, which you can lose.
What does $100 of margin buy on XYZ100?
0.1 XYZ100 at the default 30x, or 0.234 XYZ100 if you push it to 70x — both priced off 29,965.96 USDT. A loss scales the same way as the position.
Trade US tech in one position
Open appIndex gaps after earnings or CPI can be large. Keep leverage within the risk you can carry. Not available to US persons.