Apple (AAPL) stock price
AAPL/USDT · BRVX price feed
343.35 USDT
+3.30% last 30 days
Apple (AAPL) stands at 343.35 USDT on BRVX, a 0.00% change over 24 hours. The BRVX market AAPL/USDT is a perpetual contract on Apple's share price, quoted 24/7 so it keeps reacting after the Nasdaq close. Trade it long or short at 5x to 80x leverage; it is a price position, not ownership of Apple stock.
Apple perpetual terms on BRVX
- Leverage
- 80x default 40x
- AAPL fee per side
- 0.05% $0.50 per $1,000 of AAPL
- AAPL, 30 days
- 325.96 – 348.43
- AAPL funding
- 0.0023% charged every hour
- AAPL daily swing
- 1.48% average of 30
- AAPL quotes
- 24/7 outside Nasdaq hours too
AAPL/USDT: 1.25% against 80x equals the margin; 2.5% at 40x.
Apple daily range averaged 1.48% (30 sessions); 4 topped 2.5%; peak range 3.23%, Oct 1.
A $1,000 Apple position is 2.91 AAPL at 343.35 USDT: opening it costs $0.50, closing $0.50, and each day held adds about $0.55 of AAPL funding.
Apple at 80x: 1.25% against you can lose the whole margin. Past swings are no forecast.
Sources: BRVX tariffs API; AAPL/USDT daily candles.
About Apple
The iPhone company, and then some
Apple, based in Cupertino, California, earns about half its revenue from the iPhone. The rest comes from Mac computers, iPads, wearables such as the Apple Watch and AirPods, and a growing Services arm: the iPhone app marketplace, iCloud, Apple Music, Apple TV+ and payments. Services carry much higher margins than hardware, so their growth has become central to how the stock is valued. Tim Cook has run Apple since 2011.
What pushes AAPL around
iPhone demand is still the biggest single swing factor, especially in China, where local brands compete hard. Traders also follow rulings on app-marketplace fees and antitrust cases in the US and EU, which threaten the fees Apple charges developers, plus tariffs on devices assembled in China and India. Apple spends heavily on share buybacks, which tends to support the price during quiet periods.
The yearly rhythm
Apple's calendar is unusually predictable. New iPhones are shown at an event in September, the WWDC developer conference in June previews software and features, and the fiscal year ends in late September. Results arrive after the Nasdaq close in late January, April, July and October; the January report covers the holiday quarter, usually the largest of the year.
History in brief
Apple went public in 1980, nearly went bankrupt in the late 1990s and was rebuilt after Steve Jobs returned in 1997. The iPhone launched in 2007 and turned Apple into one of the most valuable listed companies. The stock has been split five times, most recently 4-for-1 in August 2020, so older share prices look far higher before adjustment.
Supply chain and tariffs
Most iPhones are assembled by Foxconn and other partners in China, with a growing share now made in India and some products in Vietnam. That makes Apple sensitive to US tariffs and to trade tensions with China. When Washington announces new import duties, AAPL often reacts quickly, since the cost either cuts margins or pushes up prices for buyers.
AAPL/USDT on BRVX
BRVX lists Apple as AAPL/USDT, a synthetic perpetual contract following the share price in USDT. Margin goes in as USDC, BTC, ETH, USDT, SOL or BNB, and the contract has no end date. The quote keeps moving after 16:00 New York time and over weekends, which helps around September launch reviews and late-evening court rulings. Apple's dividend is not paid on the perp, because no shares are held.
Apple price history
Apple +2.91% in 30 sessions: 16 up, 13 down; top move −2.44% on Sep 30; 7d 331.17–348.43; 30d 325.96–348.43.
| Date | Open | High | Low | Close | Change |
|---|---|---|---|---|---|
| Oct 14, 2026 | 341.76 | 348.43 | 340.61 | 340.65 | −0.32% |
| Oct 13, 2026 | 337.05 | 343.01 | 336.96 | 341.75 | +1.40% |
| Oct 12, 2026 | 336.34 | 337.05 | 336.29 | 337.05 | +0.21% |
| Oct 11, 2026 | 336.31 | 336.67 | 336.15 | 336.34 | +0.01% |
| Oct 10, 2026 | 337.93 | 338.85 | 331.17 | 336.31 | −1.32% |
| Oct 9, 2026 | 336.63 | 341.79 | 336.19 | 340.81 | +1.24% |
| Oct 8, 2026 | 334.90 | 338.56 | 332.92 | 336.63 | +0.78% |
Prices from the BRVX feed, AAPL/USDT. Last candle Oct 14, 2026 UTC.
Apple: the full price history and all-time high
Apple all-time high on BRVX: 348.43 USDT (Oct 14, 2026). Low: 273.33 USDT (Jun 27, 2026). Now 340.65, −2.23% off the top, 24.63% over the bottom. AAPL/USDT history here starts Jun 26, 2026, 110 daily candles; older AAPL trading is not counted.
- AAPL peak
- 348.43 Oct 14, 2026
- AAPL bottom
- 273.33 Jun 27, 2026
- From the peak
- −2.23% peak 348.43
- On BRVX since
- Jun 26, 2026 110 candles
- Best AAPL day
- +4.74% Jul 3, 2026
- Worst AAPL day
- −8.20% Jul 31, 2026
Apple returns by period
| Period | AAPL change |
|---|---|
| 7 days | +1.98% |
| 30 days | +2.91% |
| 90 days | +3.86% |
| Year to date | AAPL history starts later |
| Full AAPL history | +22.62% |
Apple by month
| Month | AAPL open | High | Low | Close | AAPL change |
|---|---|---|---|---|---|
| Oct 2026 · to date | 330.43 | 348.43 | 325.96 | 340.65 | +3.09% |
| Sep 2026 | 319.08 | 345.36 | 310.35 | 330.43 | +3.56% |
| Aug 2026 | 307.02 | 322.32 | 300.36 | 319.08 | +3.93% |
| Jul 2026 | 281.23 | 343.19 | 280.58 | 312.64 | +11.17% |
| Jun 2026 · partial | 277.81 | 286.97 | 273.33 | 281.24 | +1.23% |
Apple by day of the week
Apple on BRVX, Sat–Sun: 0.72% average move vs 1.05% Mon–Fri (0.68×); weekends ran calmer.
| Day | Days | AAPL avg | Avg size | Up |
|---|---|---|---|---|
| Monday | 15 | +0.12% | 0.31% | 73% |
| Tuesday | 16 | −0.11% | 0.94% | 44% |
| Wednesday | 16 | +0.29% | 1.12% | 44% |
| Thursday | 15 | +0.72% | 1.06% | 73% |
| Friday | 15 | +0.17% | 1.83% | 67% |
| Saturday | 16 | +0.37% | 1.25% | 50% |
| Sunday | 16 | −0.09% | 0.18% | 44% |
AAPL at 80x: a 1.25% move the wrong way can lose the whole margin.
AAPL/USDT daily candles from the BRVX feed, UTC, to Oct 14, 2026. Past moves do not predict future prices.
Apple next to similar markets
Apple's 80x cap sits between Alphabet at 60x and Microsoft at 100x. Of the 5 markets set against Apple here, 3 allow more leverage than its 80x, 2 allow less, and 0 charge a lower fee than its 0.05% per side.
| Market | 24h | Gap vs AAPL | Leverage cap |
|---|---|---|---|
| Apple | — | — | 80x cap |
 Microsoft Microsoft | — | — | +20x vs AAPL |
| Alphabet | — | — | −20x vs AAPL |
 Amazon Amazon | — | — | +20x vs AAPL |
| Meta | — | — | +20x vs AAPL |
 XYZ100 XYZ100 | — | — | −10x vs AAPL |
Where AAPL's cap is higher, a smaller move can lose the whole margin.
Before you open a Apple position
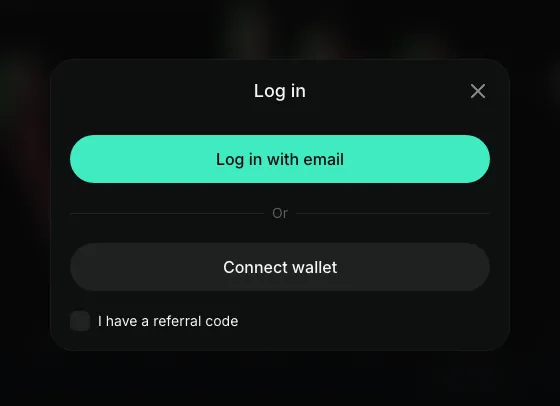
Sign up
Enter an email or link a crypto wallet.
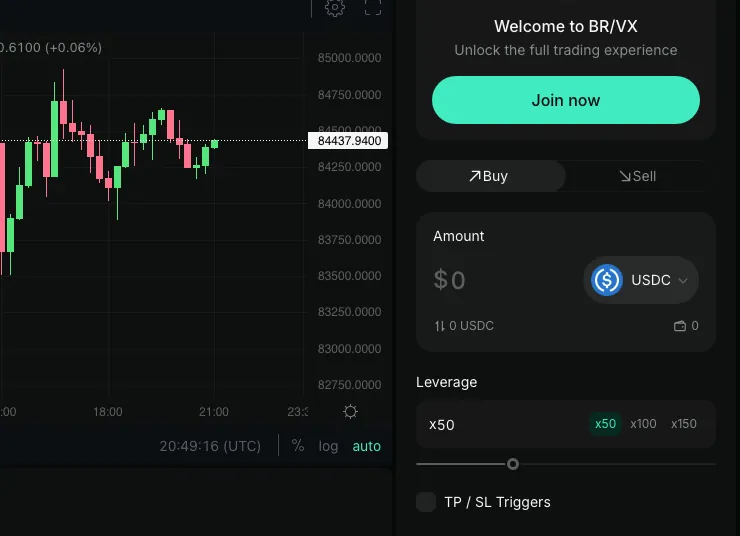
Deposit
Move crypto into the account as the margin behind your Apple trade.
Open a position on AAPL/USDT
Long if you expect a strong iPhone cycle, short if you think China sales or app-marketplace rules weigh on it. Choose 5x–80x; each extra step of leverage makes losses on a surprise move bigger.
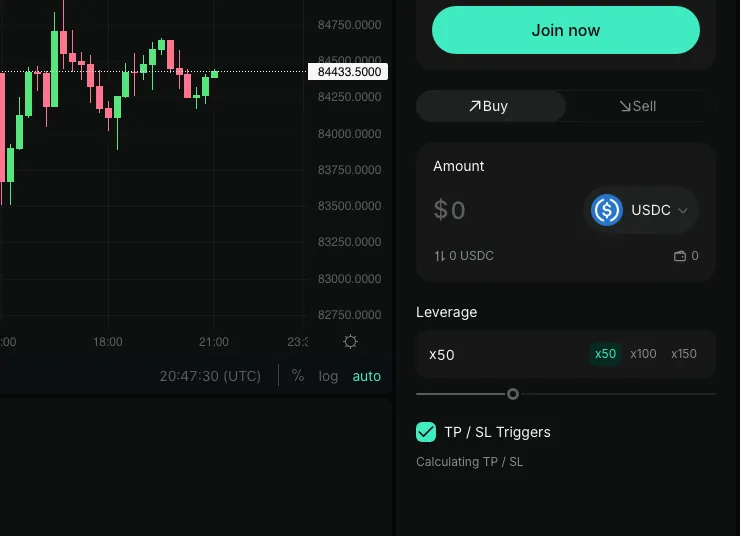


AAPL at 80x: a 1.25% move the wrong way can lose the whole margin.
An Apple trade from both sides
Example AAPL/USDT numbers around an iPhone launch. Fees and funding are not included.
Apple usually moves less than most tech stocks, which tempts traders to raise the multiplier. A calm stock at high leverage can still lose the whole margin on one ruling or report.
- Price move
- +3% $353.65
- Position P&L
- +$30.00
- On margin
- +15%
Hypothetical AAPL figures. At 5x, 20% against you equals the margin; you can lose all of it.
Calculate your liquidation priceApple price FAQ
Step-by-step long and short: how to trade Apple. Next report date and call time: Apple earnings date.
What is Apple's share price right now?
On BRVX, AAPL/USDT stands at 343.35 USDT, 0.00% compared with a day ago. It is quoted 24/7, including evenings and weekends.
Why is Apple stock down or up today?
Common reasons: iPhone sales data from China, a court or regulator decision on the fees Apple charges app developers, tariff news for devices built in Asia, or a change in expectations before the September event or a report.
How much leverage is allowed on Apple?
From 5x up to 80x, with 40x preset in the order form. Because Apple looks steady, it is easy to over-size; at the top of the range a small move against you can lose the full margin.
What are the trading costs for AAPL?
0.05% of the position when you open, 0.05% when you close, and funding of 0.0023% each hour while the position stays open.
What is a typical daily swing for Apple?
About 1.48%, averaged over 30 sessions (16 up, 13 down); the widest was 3.23% on Oct 1. At the default 40x, a 2.5% move the wrong way empties the margin.
How far does $100 go on AAPL?
Far enough for 11.6 AAPL at 40x default leverage, 23.3 at the 80x cap, all off a 343.35 USDT price. Whatever multiplies the position multiplies the loss.
What is Apple's record high on BRVX?
348.43 USDT, set Oct 14, 2026 — the highest AAPL/USDT print since BRVX started recording it on Jun 26, 2026. It now sits −2.23% under that, at 340.65. The floor so far: 273.33 USDT (Jun 27, 2026).
Is Apple still tradable on Saturday and Sunday?
Yes, around the clock. AAPL has averaged 0.72% of weekend movement against 1.05% on a weekday since Jun 26, 2026, and leverage scales either one.
Apple news, priced before the opening bell
Open appA single court ruling can move AAPL fast; leverage makes the losses larger too. Not available to US persons.