AMD stock price
AMD/USDT · BRVX price feed
569.95 USDT
+15.48% last 30 days
AMD is priced at 569.95 USDT on BRVX, −6.40% over the past 24 hours. BRVX offers it as AMD/USDT, a perpetual contract tied to the AMD share price that is quoted every hour of every day. Open long or short with 5x to 100x leverage; the contract tracks price only and gives no AMD shares.
AMD perpetual terms on BRVX
- Leverage
- 100x default 50x
- AMD fee per side
- 0.05% $0.50 per $1,000 of AMD
- AMD, 30 days
- 480.90 – 658.66
- AMD funding
- 0.0034% charged every hour
- AMD daily swing
- 3.81% average of 30
- AMD quotes
- 24/7 outside Nasdaq hours too
AMD/USDT: 1% against 100x equals the margin; 2% at 50x.
AMD daily range averaged 3.81% (30 sessions); 24 topped 2%; peak range 10.3%, Sep 22.
A $1,000 AMD position is 1.75 AMD at 569.95 USDT: opening it costs $0.50, closing $0.50, and each day held adds about $0.82 of AMD funding.
AMD at 100x: 1% against you can lose the whole margin. Past swings are no forecast.
Sources: BRVX tariffs API; AMD/USDT daily candles.
About AMD
Chips for PCs, servers and AI
Advanced Micro Devices, based in Santa Clara, California, designs processors: Ryzen CPUs for PCs, EPYC CPUs for servers, Radeon graphics cards and the Instinct line of AI accelerators. It also builds custom chips for the PlayStation and Xbox consoles and, since buying Xilinx in 2022, programmable FPGA chips. Like NVIDIA, AMD does not own fabs; TSMC makes its chips.
The comeback story
In the early 2010s AMD was losing money and its shares traded in low single digits. Lisa Su became CEO in 2014 and bet on the Zen CPU design, launched in 2017. Over the following years AMD took server and PC share from Intel, and the stock rose many times over. That history explains why the market reacts so strongly to any sign that share gains are slowing.
What moves AMD now
The data-center segment is the focus: EPYC server sales and, above all, how many Instinct accelerators AMD can sell against NVIDIA. Traders watch announced deals with cloud providers and AI labs, the yearly AI-revenue target, PC demand, and console cycles. US export rules for China hit AMD's AI chips as they do NVIDIA's.
When news lands
AMD reports after the US close, usually in late January or early February, late April or early May, late July or early August and late October or early November. It also holds an AI event where it shows new accelerators, and NVIDIA's results a few weeks later often move AMD too.
Consoles, FPGAs and embedded chips
Beyond PCs and servers, AMD designs the custom processors inside Sony's PlayStation 5 and Microsoft's Xbox Series consoles, so sales in that segment rise and fall with the console cycle. The Xilinx purchase added FPGA chips used in cars, factories and telecom gear. These lines are smaller and slower, but a downturn in them can still drag on a quarter.
AMD/USDT on BRVX
AMD/USDT follows the AMD share price as a synthetic perpetual contract quoted in USDT. It is backed by margin in USDC, BTC, ETH, USDT, SOL or BNB and never expires. Because it trades all week, you can react to an evening AI-deal announcement or a competitor's report without waiting for Nasdaq. No shares or voting rights are involved.
AMD price history
AMD +22.58% in 30 sessions: 19 up, 10 down; top move +9.98% on Sep 22; 7d 567.52–650.51; 30d 480.90–658.66.
| Date | Open | High | Low | Close | Change |
|---|---|---|---|---|---|
| Oct 14, 2026 | 590.16 | 610.98 | 571.73 | 608.78 | +3.16% |
| Oct 13, 2026 | 613.07 | 614.53 | 587.26 | 590.16 | −3.73% |
| Oct 12, 2026 | 609.56 | 615.23 | 608.05 | 613.00 | +0.56% |
| Oct 11, 2026 | 608.81 | 612.39 | 608.49 | 609.56 | +0.12% |
| Oct 10, 2026 | 632.66 | 634.03 | 606.29 | 608.81 | −1.66% |
| Oct 9, 2026 | 646.94 | 650.51 | 613.92 | 619.06 | −4.32% |
| Oct 8, 2026 | 643.86 | 648.24 | 634.13 | 647.01 | −0.75% |
Prices from the BRVX feed, AMD/USDT. Last candle Oct 14, 2026 UTC.
AMD price history & all-time high on BRVX
AMD all-time high on BRVX: 658.66 USDT (Oct 7, 2026). Low: 420.66 USDT (Jul 30, 2026). Now 608.78, −7.57% off the top, 44.72% over the bottom. AMD/USDT history here starts Jun 24, 2026, 113 daily candles; older AMD trading is not counted.
- AMD peak
- 658.66 Oct 7, 2026
- AMD bottom
- 420.66 Jul 30, 2026
- From the peak
- −7.57% peak 658.66
- On BRVX since
- Jun 24, 2026 113 candles
- Best AMD day
- +16.75% Jul 31, 2026
- Worst AMD day
- −9.48% Jul 28, 2026
AMD returns by period
| Period | AMD change |
|---|---|
| 7 days | −6.62% |
| 30 days | +22.58% |
| 90 days | +15.20% |
| Year to date | AMD history starts later |
| Full AMD history | +19.07% |
AMD by month
| Month | AMD open | High | Low | Close | AMD change |
|---|---|---|---|---|---|
| Oct 2026 · to date | 609.39 | 658.66 | 571.73 | 608.78 | −0.10% |
| Sep 2026 | 462.90 | 645.51 | 452.98 | 609.39 | +31.65% |
| Aug 2026 | 508.72 | 532.18 | 451.36 | 463.00 | −8.99% |
| Jul 2026 | 583.17 | 584.42 | 420.66 | 500.03 | −14.26% |
| Jun 2026 · partial | 511.27 | 542.38 | 504.85 | 541.27 | +5.87% |
AMD by day of the week
AMD on BRVX, Sat–Sun: 1.48% average move vs 2.85% Mon–Fri (0.52×); weekends ran calmer.
| Day | Days | AMD avg | Avg size | Up |
|---|---|---|---|---|
| Monday | 16 | +0.54% | 1.36% | 75% |
| Tuesday | 16 | −0.66% | 3.10% | 44% |
| Wednesday | 16 | +0.84% | 4.00% | 63% |
| Thursday | 16 | −0.45% | 2.26% | 56% |
| Friday | 16 | +0.66% | 3.54% | 50% |
| Saturday | 16 | +0.32% | 2.57% | 56% |
| Sunday | 16 | +0.12% | 0.39% | 69% |
AMD at 100x: a 1% move the wrong way can lose the whole margin.
AMD/USDT daily candles from the BRVX feed, UTC, to Oct 14, 2026. Past moves do not predict future prices.
AMD next to similar markets
AMD's 100x cap sits between NVIDIA at 50x and Intel at 100x. In the last 24 hours AMD led the group, −6.40%. Of the 5 markets set against AMD here, 0 allow more leverage than its 100x, 4 allow less, and 0 charge a lower fee than its 0.05% per side.
| Market | 24h | Gap vs AMD | Leverage cap |
|---|---|---|---|
| AMD | −6.40% | — | 100x cap |
| NVIDIA | −3.31% | +3.09 pp | −50x vs AMD |
| Intel | −5.00% | +1.40 pp | same as AMD |
 Micron Micron | — | — | −20x vs AMD |
 Marvell Marvell | — | — | −20x vs AMD |
 XYZ100 XYZ100 | — | — | −30x vs AMD |
Where AMD's cap is higher, a smaller move can lose the whole margin.
Before you open a AMD position
Get in
Log in with email, or connect a wallet with WalletConnect.

Fund the account
Deposit a coin or stablecoin; it secures the AMD contract.
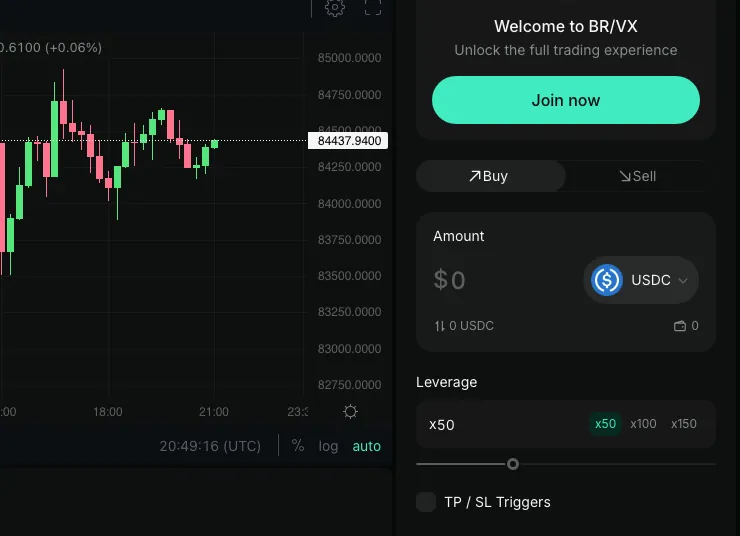
Set up AMD/USDT
Long if you expect AMD to win AI and server share, short if NVIDIA or Intel look stronger. Pick a leverage from 5x to 100x; the higher it is, the bigger the losses when AMD gaps against you.
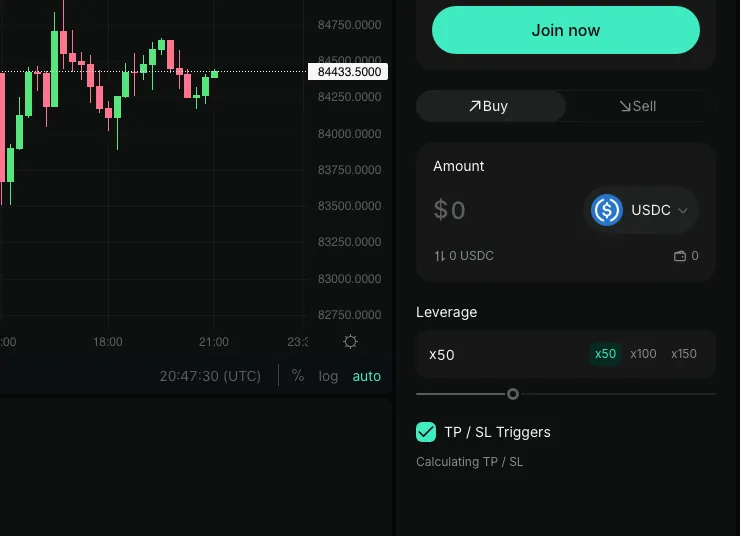


AMD at 100x: a 1% move the wrong way can lose the whole margin.
How an AMD position plays out
A hypothetical AMD/USDT trade on AI-chip news, not counting fees or funding.
At 8x, a 5% move is 40% of the margin and a move near 12% could lose all of it. AMD has moved that much in a single day.
- Price move
- +3% $587.05
- Position P&L
- +$28.80
- On margin
- +24%
Hypothetical AMD figures. At 8x, 12.5% against you equals the margin; you can lose all of it.
Calculate your liquidation priceAMD price FAQ
Step-by-step long and short: how to trade AMD. Next report date and call time: AMD earnings date.
What is AMD stock trading at?
AMD/USDT is at 569.95 USDT on BRVX right now, −6.40% in the past 24 hours, with the quote running around the clock.
How does AMD compete with Intel?
In PC and server processors. AMD's Ryzen and EPYC chips have taken share from Intel since 2017, helped by TSMC's manufacturing. Intel trades on BRVX too, so you can follow both.
What leverage can I use on AMD?
Between 5x and 100x; the order form starts at 50x. A chip stock that can move 10% in a day can lose you the entire margin at high multipliers, so size the trade for that.
What are AMD trading fees?
0.05% on the position size to open, 0.05% to close, and funding of 0.0034% every hour while you hold it.
How much does AMD move in a day?
3.81% on an average AMD day (30 sessions); peak range 10.3% on Sep 22; 19 up, 10 down. At 50x, 2% against you equals the margin, which you can lose.
What does $100 of margin buy on AMD?
8.77 AMD at the default 50x, or 17.5 AMD if you push it to 100x — both priced off 569.95 USDT. A loss scales the same way as the position.
What is the AMD all-time high on BRVX?
658.66 USDT on Oct 7, 2026, the AMD/USDT top on the BRVX feed (history since Jun 24, 2026). Now 608.78, −7.57% below it. All-time low: 420.66 USDT (Jul 30, 2026).
Can weekend moves in AMD wipe out margin?
They can: AMD has swung 1.48% on an average weekend day since Jun 24, 2026, versus 2.85% on a weekday, and leverage applies the same way both days.
Trade the AI chip race as it happens
Open appAMD can gap on a rival's report; leverage multiplies the losses as well. Not available to US persons.