
Brent crude oil price
BRENTOIL/USDT · BRVX price feed
103.46 USDT
+1.99% last 30 days
Brent crude costs 103.46 USDT a barrel on BRVX, a 0.00% change in 24 hours. The market is BRENTOIL/USDT, a synthetic perpetual on the international oil benchmark that never needs rolling, with prices updating through Saturday and Sunday as Middle East and shipping news arrives.
Brent Oil perpetual terms on BRVX
- Leverage
- 100x default 40x
- BRENTOIL fee per side
- 0.05% $0.50 per $1,000 of BRENTOIL
- BRENTOIL, 30 days
- 93.77 – 105.30
- BRENTOIL funding
- 0.0057% charged every hour
- BRENTOIL daily swing
- 3.28% average of 30
- BRENTOIL quotes
- 24/7 weekends included
BRENTOIL/USDT: 1% against 100x equals the margin; 2.5% at 40x.
Brent Oil daily range averaged 3.28% (30 sessions); 19 topped 2.5%; peak range 6.58%, Oct 2.
A $1,000 Brent Oil position is 9.67 BRENTOIL at 103.46 USDT: opening it costs $0.50, closing $0.50, and each day held adds about $1.37 of BRENTOIL funding.
Brent Oil at 100x: 1% against you can lose the whole margin. Past swings are no forecast.
Sources: BRVX tariffs API; BRENTOIL/USDT daily candles.
About Brent crude
The world's reference barrel
Brent began as oil from a single North Sea field discovered in the 1970s. Output there has shrunk, so today's benchmark blends several North Sea grades and, since 2023, US WTI Midland cargoes delivered to Europe. Most physical crude sold across Europe, Africa and the Middle East is priced as Brent plus or minus a differential, which makes it the number oil ministers and airlines watch.
Geopolitics and shipping lanes
Around a fifth of global oil passes through the Strait of Hormuz, and tankers heading to Europe sail via the Red Sea and Suez. Attacks on shipping, sanctions on Russian or Iranian exports and outages in Libya or Nigeria add a risk premium to Brent faster than to WTI, because Brent prices waterborne cargoes that must travel those routes.
The Brent–WTI spread
Brent normally trades a few dollars above WTI. The gap widened past $25 in 2011 when US output outgrew pipeline capacity to the coast, and narrowed after the US lifted its crude export ban at the end of 2015. Watching the spread tells you whether a move is global or specific to US supply.
How OPEC+ steers the barrel
OPEC's 12 members and allies led by Russia, known together as OPEC+, meet regularly to set output targets. Saudi Arabia has repeatedly made extra voluntary cuts to support prices, while quota disputes, such as those that led Angola to leave OPEC in 2023, weaken the group's grip. Because the cartel's barrels are mostly priced off Brent, its meetings in Vienna or online are key dates for this benchmark, more so than for WTI.
Europe, Asia and seasonal demand
Refinery maintenance in spring and autumn lowers crude buying for a few weeks, while winter heating and the summer travel season raise fuel demand. Chinese import quotas and Indian refinery runs matter because Asia takes most seaborne crude, and European diesel shortages can pull Brent up even when US supply is plentiful.
Brent on BRVX
You trade BRENTOIL/USDT, which follows the Brent price without an expiry month. Collateral is USDC, BTC, ETH, USDT, SOL or BNB and the leverage range is 5x to 100x; one tanker incident can shift Brent several percent overnight, so a high multiplier risks losing the whole position margin in a single headline.
Brent Oil price history
Brent Oil near flat, +0.16% in 30 sessions: 14 up, 15 down; top move +4.89% on Oct 2; 7d 100.23–105.30; 30d 93.77–105.30.
| Date | Open | High | Low | Close | Change |
|---|---|---|---|---|---|
| Oct 14, 2026 | 103.42 | 104.49 | 102.03 | 103.52 | +0.10% |
| Oct 13, 2026 | 101.67 | 105.26 | 100.47 | 103.42 | +1.72% |
| Oct 12, 2026 | 102.38 | 103.57 | 101.64 | 101.67 | −0.70% |
| Oct 11, 2026 | 102.15 | 102.39 | 101.74 | 102.38 | +0.23% |
| Oct 10, 2026 | 102.33 | 103.70 | 101.26 | 102.15 | −0.41% |
| Oct 9, 2026 | 100.46 | 105.30 | 100.23 | 102.57 | +2.09% |
| Oct 8, 2026 | 101.50 | 102.60 | 99.76 | 100.46 | −0.72% |
Prices from the BRVX feed, BRENTOIL/USDT. Last candle Oct 14, 2026 UTC.
How Brent Oil has traded: all-time high, all-time low, history
Brent Oil all-time high on BRVX: 107.16 USDT (Sep 11, 2026). Low: 70.25 USDT (Jul 3, 2026). Now 103.52, −3.39% off the top, 47.37% over the bottom. BRENTOIL/USDT history here starts Jun 26, 2026, 110 daily candles; older BRENTOIL trading is not counted.
- BRENTOIL peak
- 107.16 Sep 11, 2026
- BRENTOIL bottom
- 70.25 Jul 3, 2026
- From the peak
- −3.39% peak 107.16
- On BRVX since
- Jun 26, 2026 110 candles
- Best BRENTOIL day
- +9.59% Jul 14, 2026
- Worst BRENTOIL day
- −7.02% Aug 3, 2026
Brent Oil returns by period
| Period | BRENTOIL change |
|---|---|
| 7 days | +2.30% |
| 30 days | +0.16% |
| 90 days | +23.27% |
| Year to date | BRENTOIL history starts later |
| Full BRENTOIL history | +38.31% |
Brent Oil by month
| Month | BRENTOIL open | High | Low | Close | BRENTOIL change |
|---|---|---|---|---|---|
| Oct 2026 · to date | 95.84 | 105.30 | 95.19 | 103.52 | +8.02% |
| Sep 2026 | 89.64 | 107.16 | 89.04 | 95.84 | +6.91% |
| Aug 2026 | 88.18 | 93.03 | 78.20 | 89.64 | +1.66% |
| Jul 2026 | 73.45 | 95.37 | 70.25 | 87.41 | +19.01% |
| Jun 2026 · partial | 74.85 | 76.07 | 71.97 | 73.45 | −1.87% |
Brent Oil price moves, broken down by weekday
Brent Oil on BRVX, Sat–Sun: 1.26% average move vs 2.01% Mon–Fri (0.63×); weekends ran calmer.
| Day | Days | BRENTOIL avg | Avg size | Up |
|---|---|---|---|---|
| Monday | 15 | −0.48% | 1.57% | 33% |
| Tuesday | 16 | +0.59% | 2.04% | 56% |
| Wednesday | 16 | +0.10% | 2.26% | 69% |
| Thursday | 15 | +0.69% | 1.73% | 60% |
| Friday | 15 | +1.52% | 2.43% | 67% |
| Saturday | 16 | −0.30% | 1.70% | 38% |
| Sunday | 16 | +0.19% | 0.82% | 63% |
BRENTOIL at 100x: a 1% move the wrong way can lose the whole margin.
BRENTOIL/USDT daily candles from the BRVX feed, UTC, to Oct 14, 2026. Past moves do not predict future prices.
Brent Oil next to similar markets
Brent Oil's 100x cap sits between WTI Oil at 70x and Euro at 150x. Fees run from 0.05% per side at Brent Oil to 0.08% at Tether Gold. In the last 24 hours Tether Gold led the group, −1.38%. Out of 5 markets next to Brent Oil, 1 go past its 100x cap, 2 fall short of it, and 0 beat its 0.05% per-side fee.
| Market | 24h | Gap vs BRENTOIL | Leverage cap |
|---|---|---|---|
| Brent Oil | — | — | 100x cap |
| WTI Oil | — | — | −30x vs BRENTOIL |
| Copper | — | — | −20x vs BRENTOIL |
 Silver Silver | — | — | same as BRENTOIL |
 Tether Gold Tether Gold | −1.38% | — | same as BRENTOIL |
 Euro Euro | −0.37% | — | +50x vs BRENTOIL |
Where BRENTOIL's cap is higher, a smaller move can lose the whole margin.
Before you open a Brent Oil position
Get in through email or a wallet
There is no energy-futures account to apply for; one BRVX login gives access to Brent and every other listed market.

Top up margin
Send USDC, BTC, ETH, USDT, SOL or BNB; the balance backs the Brent position and anything else you hold open.
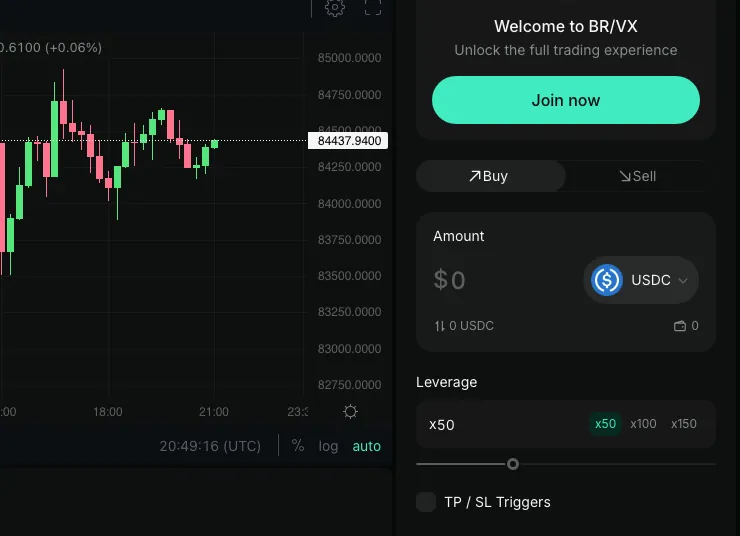
Position on global supply
Open BRENTOIL/USDT. Buy if you think a shipping disruption or OPEC+ cut will tighten supply, sell if you expect demand from Europe and Asia to weaken, and attach TP / SL levels.
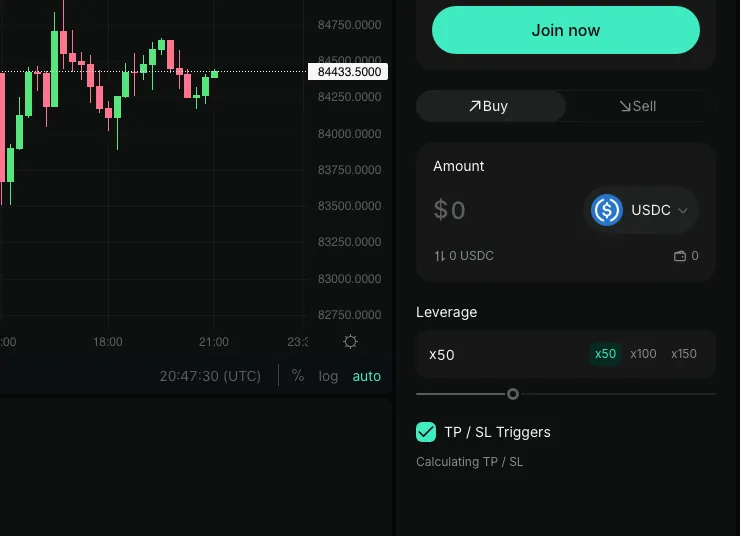


BRENTOIL at 100x: a 1% move the wrong way can lose the whole margin.
Long or short Brent
BRENTOIL/USDT sample, fees and funding not included. Contract value = margin × leverage.
Wrong direction, same maths: a $30 loss. At 50x, 2% against you takes the entire $250.
 BRENTOIL Brent Oil
 - Price move
- +3% $106.56
- Position P&L
- +$45.00
- On margin
- +18%
Hypothetical BRENTOIL figures. At 6x, 16.67% against you equals the margin; you can lose all of it.
Calculate your liquidation priceBrent Oil price FAQ
Step-by-step long and short: how to trade Brent Oil.
What is the Brent oil price today?
Brent is 103.46 USDT per barrel on the BRVX BRENTOIL/USDT feed, 0.00% in the past 24 hours.
What are the costs on BRENTOIL/USDT?
0.05% on entry and 0.05% on exit, based on position size, plus funding every hour at 0.0057% long and 0.0057% short.
What leverage can I use on Brent?
From 5x to 100x. Brent can jump on overnight headlines, so with high leverage a single gap may mean losing the whole margin.
When did Brent reach its record high?
In July 2008 the front-month contract touched about $147 a barrel, shortly before the financial crisis sent it below $40 by that December.
How much does Brent Oil move in a day?
3.28% on an average BRENTOIL day (30 sessions); peak range 6.58% on Oct 2; 14 up, 15 down. At 40x, 2.5% against you equals the margin, which you can lose.
How much BRENTOIL does $100 of margin control?
At 103.46 USDT: 38.7 BRENTOIL at 40x, 96.7 BRENTOIL at 100x. Losses grow by the same multiple.
What is the Brent Oil all-time high on BRVX?
107.16 USDT on Sep 11, 2026, the BRENTOIL/USDT top on the BRVX feed (history since Jun 26, 2026). Now 103.52, −3.39% below it. All-time low: 70.25 USDT (Jul 3, 2026).
Does Brent Oil move on weekends on BRVX?
Yes. Since Jun 26, 2026, BRENTOIL moved 1.26% per weekend day vs 2.01% per weekday on BRVX, either direction. Leverage multiplies weekend losses too.
Trade Brent when OPEC+ speaks
Open appBrent reprices on shipping and war headlines around the clock. Leverage adds to that risk. Not available to US persons.