
EUR/USD exchange rate
EUR/USDT · BRVX price feed
1.1166 USDT
−3.37% last 30 days
The euro buys 1.1166 USDT US dollars on BRVX, a −0.37% shift over 24 hours. BRVX quotes the world's most-traded currency pair as EUR/USDT, a synthetic perpetual where USDT stands in for the dollar, tradable in either direction with crypto margin.
EUR/USD perpetual terms on BRVX
- Leverage
- 150x default 100x
- EUR fee per side
- 0.05% $0.50 per $1,000 of EUR
- EUR, 30 days
- 1.1166 – 1.1695
- EUR funding
- 0.0046% charged every hour
- EUR daily swing
- 0.49% average of 30
- EUR quotes
- 24/7 quieter at weekends
EUR/USDT: 0.667% against 150x equals the margin; 1% at 100x.
EUR/USD daily range averaged 0.49% (30 sessions); 3 topped 1%; peak range 2%, Sep 22.
A $1,000 EUR/USD position is 896 EUR at 1.1166 USDT: opening it costs $0.50, closing $0.50, and each day held adds about $1.10 of EUR funding.
EUR/USD at 150x: 0.667% against you can lose the whole margin. Past swings are no forecast.
Sources: BRVX tariffs API; EUR/USDT daily candles.
About EUR/USD
Base, quote and pips
In EUR/USD the euro is the base currency and the dollar is the quote, so a reading of 1.0850 means one euro costs 1.0850 dollars. A rise means the euro is strengthening. Forex desks count moves in pips, the fourth decimal place: going from 1.0850 to 1.0900 is a 50-pip move, a little under half a percent. On BRVX the dollar leg is USDT, which is designed to hold one dollar but can drift slightly from it.
Two central banks, one spread
The pair is largely a contest between the European Central Bank in Frankfurt and the Federal Reserve in Washington. When markets expect the Fed to keep rates higher than the ECB, dollar deposits pay more and the euro tends to weaken. ECB press conferences, euro-area HICP inflation, German Ifo and PMI surveys, and US payrolls and CPI are the scheduled days when the rate jumps most.
Milestones since 1999
The euro launched at 1.1747 dollars in January 1999, sank to about 0.83 in October 2000, and peaked near 1.60 in July 2008 before the financial crisis. In 2022, with an energy shock in Europe and aggressive Fed hikes, it fell below parity for the first time in two decades. Moves of more than 10% in a year are rare but not unusual for this pair.
Trading sessions
Liquidity in the euro peaks when London and New York overlap, roughly 12:00–16:00 UTC, and many big banks fix their daily rates at the 16:00 London WM/Reuters benchmark. Asian hours are usually calmer. Spot FX pauses from Friday night to Sunday evening, while EUR/USDT on BRVX keeps quoting, so a weekend political surprise in Europe shows up here before banks reopen.
EUR/USD on BRVX
You trade EUR/USDT: no bank account in euros, no fiat conversion, margin in USDC, BTC, ETH, USDT, SOL or BNB. The range goes from 5x to 150x with a default of 100x, among the highest on the platform because daily currency moves are small; at those multipliers even a 1% move against you can cost the full margin, so the risk is higher than the quiet chart suggests.
EUR/USD price history
EUR/USD −3.33% in 30 sessions: 17 down, 10 up; top drop −1.3% on Sep 22; 7d 1.1124–1.1237; 30d 1.1166–1.1695.
| Date | Open | High | Low | Close | Change |
|---|---|---|---|---|---|
| Oct 14, 2026 | 1.1172 | 1.1216 | 1.1167 | 1.1210 | +0.34% |
| Oct 13, 2026 | 1.1215 | 1.1226 | 1.1166 | 1.1172 | −0.38% |
| Oct 12, 2026 | 1.1206 | 1.1215 | 1.1200 | 1.1215 | +0.08% |
| Oct 11, 2026 | 1.1206 | 1.1207 | 1.1201 | 1.1206 | 0.00% |
| Oct 10, 2026 | 1.1230 | 1.1237 | 1.1194 | 1.1206 | −0.11% |
| Oct 9, 2026 | 1.1204 | 1.1230 | 1.1178 | 1.1218 | +0.12% |
| Oct 8, 2026 | 1.1195 | 1.1208 | 1.1169 | 1.1204 | −0.44% |
Prices from the BRVX feed, EUR/USDT. Last candle Oct 14, 2026 UTC.
EUR/USD: the full price history and all-time high
EUR/USD all-time high on BRVX: 1.2277 USDT (Aug 24, 2026). Low: 1.0190 USDT (Jan 14, 2025). Now 1.1210, −8.69% off the top, 10.00% over the bottom. EUR/USDT history here starts Jan 2, 2025, 651 daily candles; older EUR trading is not counted.
- EUR peak
- 1.2277 Aug 24, 2026
- EUR bottom
- 1.0190 Jan 14, 2025
- From the peak
- −8.69% peak 1.2277
- On BRVX since
- Jan 2, 2025 651 candles
- Best EUR day
- +2.72% Apr 12, 2025
- Worst EUR day
- −1.73% Oct 12, 2025
EUR/USD returns by period
| Period | EUR change |
|---|---|
| 7 days | −0.39% |
| 30 days | −3.33% |
| 90 days | −2.31% |
| Year to date | −4.90% |
| Full EUR history | +8.06% |
EUR/USD by month
| Month | EUR open | High | Low | Close | EUR change |
|---|---|---|---|---|---|
| Oct 2026 · to date | 1.1344 | 1.1390 | 1.1166 | 1.1210 | −1.18% |
| Sep 2026 | 1.1587 | 1.1695 | 1.1317 | 1.1344 | −2.10% |
| Aug 2026 | 1.1507 | 1.2277 | 1.1469 | 1.1587 | +0.70% |
| Jul 2026 | 1.1435 | 1.1546 | 1.1365 | 1.1532 | +0.85% |
| Jun 2026 | 1.1673 | 1.1677 | 1.1369 | 1.1436 | −2.03% |
| May 2026 | 1.1687 | 1.1783 | 1.1597 | 1.1673 | −0.12% |
| Apr 2026 | 1.1465 | 1.1820 | 1.1457 | 1.1709 | +2.13% |
| Mar 2026 | 1.1803 | 1.1809 | 1.1401 | 1.1494 | −2.62% |
| Feb 2026 | 1.1865 | 1.1922 | 1.1753 | 1.1802 | −0.53% |
| Jan 2026 | 1.1761 | 1.2040 | 1.1587 | 1.1935 | +1.48% |
| Dec 2025 | 1.1584 | 1.1816 | 1.1582 | 1.1787 | +1.75% |
| Nov 2025 | 1.1570 | 1.1649 | 1.1479 | 1.1585 | +0.13% |
EUR/USD: weekday vs weekend moves
EUR/USD on BRVX, Sat–Sun: 0.26% average move vs 0.27% Mon–Fri (0.97×), about even.
| Day | Days | EUR avg | Avg size | Up |
|---|---|---|---|---|
| Monday | 93 | +0.01% | 0.10% | 54% |
| Tuesday | 93 | +0.04% | 0.29% | 57% |
| Wednesday | 93 | +0.03% | 0.29% | 48% |
| Thursday | 92 | +0.05% | 0.33% | 49% |
| Friday | 93 | −0.03% | 0.34% | 40% |
| Saturday | 93 | +0.02% | 0.27% | 44% |
| Sunday | 93 | −0.02% | 0.25% | 39% |
EUR at 150x: a 0.667% move the wrong way can lose the whole margin.
EUR/USDT daily candles from the BRVX feed, UTC, to Oct 14, 2026. Past moves do not predict future prices.
EUR/USD next to similar markets
EUR/USD's 150x cap sits between XYZ100 at 70x and Bitcoin at 150x. Fees run from 0.05% per side at EUR/USD to 0.1% at Bitcoin. In the last 24 hours Bitcoin led the group, −1.80%. Stack EUR/USD against these 5: 0 allow higher leverage than its 150x, 4 allow lower, and 0 charge less than its 0.05% per side.
| Market | 24h | Gap vs EUR | Leverage cap |
|---|---|---|---|
| EUR/USD | −0.37% | — | 150x cap |
 Tether Gold Tether Gold | −1.38% | −1.01 pp | −50x vs EUR |
 Bitcoin Bitcoin | −1.80% | −1.43 pp | same as EUR |
 XYZ100 XYZ100 | — | — | −80x vs EUR |
 Silver Silver | — | — | −50x vs EUR |
 WTI Oil WTI Oil | — | — | −80x vs EUR |
Where EUR's cap is higher, a smaller move can lose the whole margin.
Before you open a EUR/USD position
Skip the forex broker paperwork
Enter with an email address or a crypto wallet; no separate FX account or bank transfer is involved.

Margin in crypto, not euros
Deposit USDC, BTC, ETH, USDT, SOL or BNB. The euro trade is margined in that coin, and profit or loss is paid back in it.
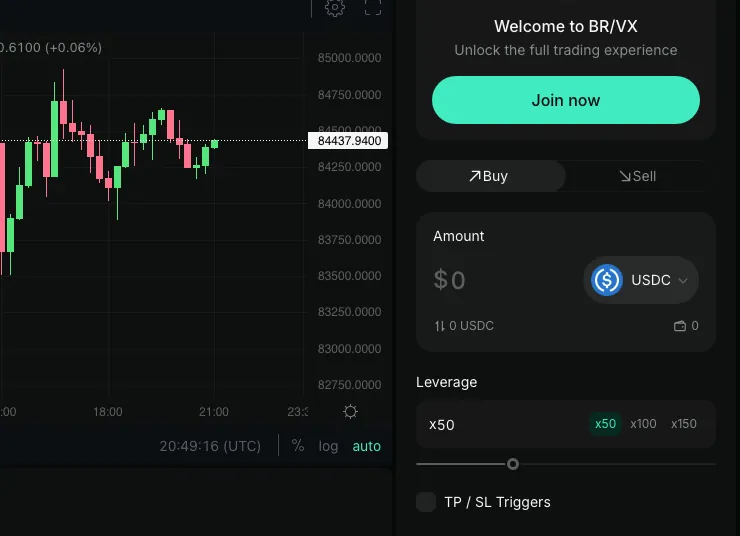
Pick a side on the rate gap
On EUR/USDT, buy if you expect the ECB to sound tougher than the Fed, sell if you expect the dollar to firm. Set TP and SL levels in pips-equivalent before ECB or Fed days.
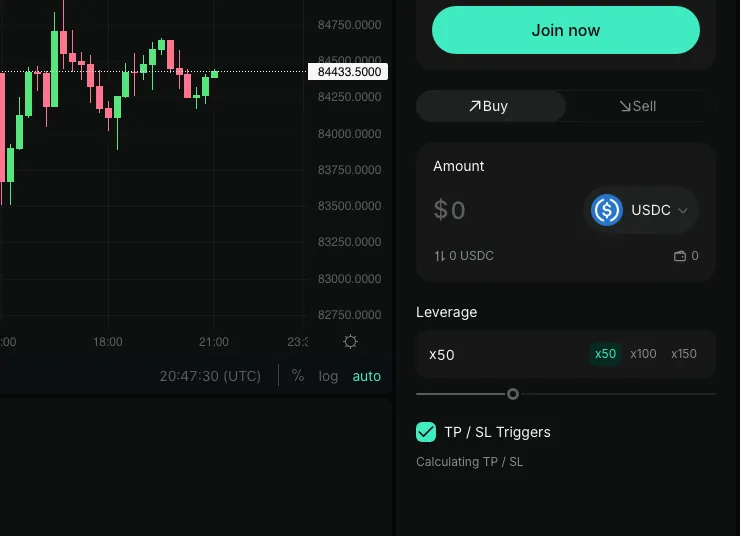


EUR at 150x: a 0.667% move the wrong way can lose the whole margin.
Long or short EUR/USD
EUR/USDT illustration; fees and funding set aside. Notional = margin × leverage, P/L ≈ notional × % change.
A 0.4% move the other way loses $12. At the 100x default, a 1% adverse swing is the entire margin.
 EUR Euro
 - Price move
- +2.7% $1.15
- Position P&L
- +$80.00
- On margin
- +80%
Hypothetical EUR figures. At 30x, 3.33% against you equals the margin; you can lose all of it.
Calculate your liquidation priceEUR/USD price FAQ
Step-by-step long and short: how to trade EUR/USD.
What is the EUR/USD rate today?
1.1166 USDT on BRVX (EUR/USDT), −0.37% over 24 hours. The page refreshes every few minutes; the app shows the live rate.
What does a EUR/USD quote of 1.08 mean?
One euro costs 1.08 US dollars. If the number rises, the euro is gaining against the dollar; if it falls, the dollar is gaining.
What is a pip in EUR/USD?
The fourth decimal place, 0.0001. A move from 1.0800 to 1.0825 is 25 pips.
Why is leverage so high on the euro?
Currency pairs typically move less than 1% a day, so BRVX allows up to 150x with a 100x default. The same leverage means a small adverse move can lose the whole margin, which makes the risk much larger than on a low setting.
What are the fees on EUR/USDT?
0.05% of size to open, 0.05% to close, and funding every hour at 0.0046% long and 0.0046% short.
When does EUR/USD move most during the day?
Around the London–New York overlap and scheduled releases such as US payrolls at 12:30 UTC (13:30 in winter) and ECB decisions.
How much does EUR/USD move in a day?
0.49% on an average EUR day (30 sessions); peak range 2% on Sep 22; 10 up, 17 down. At 100x, 1% against you equals the margin, which you can lose.
How far does $100 go on EUR?
Far enough for 8,956 EUR at 100x default leverage, 13,434 at the 150x cap, all off a 1.1166 USDT price. Whatever multiplies the position multiplies the loss.
Trade the world's most traded pair
Open appRate surprises can move the euro sharply in seconds. High leverage turns that into large losses as easily as gains. Not available to US persons.